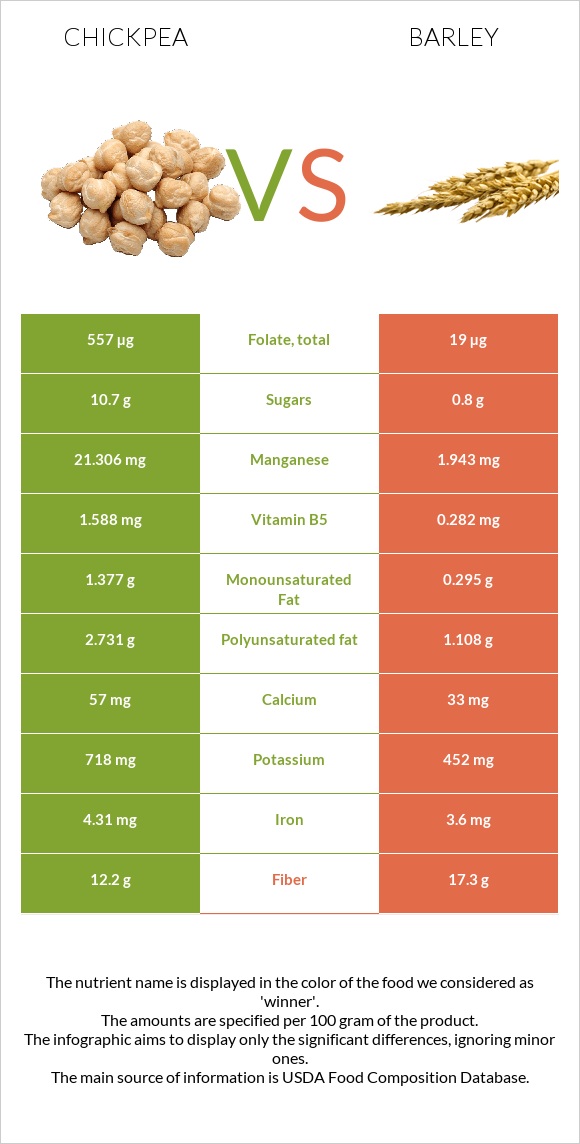
Summary of differences between chickpeas and barley Chickpeas have more folate, manganese, copper, iron, phosphorus, fiber, zinc, and magnesium; however, barley is higher in vitamin B3 and selenium. Chickpeas cover your daily need for folate, 39% more than barley. Chickpeas have 4 times more manganese than barley. While chickpeas have 1.03mg of manganese, barley has only 0.259mg. These are the specific foods used in this comparison Chickpeas (garbanzo beans, bengal gram), mature seeds, cooked, boiled, without salt and Barley, pearled, cooked .
Infographic
Mineral Comparison
Mineral comparison score is based on the number of minerals by which one or the other food is richer. The "coverage" charts below show how much of the daily needs can be covered by 300 grams of the food.
8
100 g
300 g
1 cup - 164g
Magnesium
Magnesium
Calcium
Calcium
Potassium
Potassium
Iron
Iron
Copper
Copper
Zinc
Zinc
Phosphorus
Phosphorus
Sodium
Sodium
Manganese
Manganese
Selenium
Selenium
34%
15%
26%
108%
117%
42%
72%
0.91%
134%
20%
2
100 g
300 g
1 cup - 157g
Magnesium
Magnesium
Calcium
Calcium
Potassium
Potassium
Iron
Iron
Copper
Copper
Zinc
Zinc
Phosphorus
Phosphorus
Sodium
Sodium
Manganese
Manganese
Selenium
Selenium
16%
3.3%
8.2%
50%
35%
22%
23%
0.39%
34%
47%
Vitamin Comparison
Vitamin comparison score is based on the number of vitamins by which one or the other food is richer. The "coverage" charts below show how much of the daily needs can be covered by 300 grams of the food.
8
100 g
300 g
1 cup - 164g
Vitamin C
Vit. C
Vitamin D
Vit. D
Vitamin A
Vit. A
Vitamin E
Vit. E
Vitamin B1
Vit. B1
Vitamin B2
Vit. B2
Vitamin B3
Vit. B3
Vitamin B5
Vit. B5
Vitamin B6
Vit. B6
Vitamin B12
Vit. B12
Vitamin K
Vit. K
Folate
Folate
4.3%
0%
0.33%
7%
29%
15%
9.9%
17%
32%
0%
10%
129%
1
100 g
300 g
1 cup - 157g
Vitamin C
Vit. C
Vitamin D
Vit. D
Vitamin A
Vit. A
Vitamin E
Vit. E
Vitamin B1
Vit. B1
Vitamin B2
Vit. B2
Vitamin B3
Vit. B3
Vitamin B5
Vit. B5
Vitamin B6
Vit. B6
Vitamin B12
Vit. B12
Vitamin K
Vit. K
Folate
Folate
0%
0%
0%
0.2%
21%
14%
39%
8.1%
27%
0%
2%
12%
All nutrients comparison - raw data values
Nutrient
DV% diff.
Folate
172µg
16µg
39%
Manganese
1.03mg
0.259mg
34%
Copper
0.352mg
0.105mg
27%
Iron
2.89mg
1.33mg
20%
Phosphorus
168mg
54mg
16%
Fiber
7.6g
3.8g
15%
Protein
8.86g
2.26g
13%
Vitamin B3
0.526mg
2.063mg
10%
Selenium
3.7µg
8.6µg
9%
Magnesium
48mg
22mg
6%
Potassium
291mg
93mg
6%
Zinc
1.53mg
0.82mg
6%
Polyunsaturated fat
1.156g
0.214g
6%
Choline
42.8mg
13.4mg
5%
Calcium
49mg
11mg
4%
Fats
2.59g
0.44g
3%
Vitamin B1
0.116mg
0.083mg
3%
Vitamin B5
0.286mg
0.135mg
3%
Vitamin K
4µg
0.8µg
3%
Calories
164kcal
123kcal
2%
Vitamin E
0.35mg
0.01mg
2%
Vitamin B6
0.139mg
0.115mg
2%
Vitamin C
1.3mg
0mg
1%
Saturated fat
0.269g
0.093g
1%
Monounsaturated fat
0.583g
0.057g
1%
Protein per 100 calories
5.4g
1.8g
N/A
Calories per 10 g protein
185kcal
544kcal
N/A
Weight per 100 calories
61g
81g
N/A
Unsaturated / Saturated Fat ratio
6.5
2.9
N/A
Net carbs
19.82g
24.42g
N/A
Carbs
27.42g
28.22g
0%
Sugar
4.8g
0.28g
N/A
Sodium
7mg
3mg
0%
Vitamin A
1µg
0µg
0%
Vitamin B2
0.063mg
0.062mg
0%
Tryptophan
0.085mg
0.038mg
0%
Threonine
0.329mg
0.077mg
0%
Isoleucine
0.38mg
0.083mg
0%
Leucine
0.631mg
0.154mg
0%
Lysine
0.593mg
0.084mg
0%
Methionine
0.116mg
0.043mg
0%
Phenylalanine
0.475mg
0.127mg
0%
Valine
0.372mg
0.111mg
0%
Histidine
0.244mg
0.051mg
0%
Macronutrient Comparison
Macronutrient breakdown side-by-side comparison
3
9%
3%
27%
60%
Protein:
8.86 g
Fats:
2.59 g
Carbs:
27.42 g
Water:
60.21 g
Other:
0.92 g
2
2%
28%
69%
Protein:
2.26 g
Fats:
0.44 g
Carbs:
28.22 g
Water:
68.8 g
Other:
0.28 g
Contains
more
Protein Protein
+292%
Contains
more
Fats Fats
+488.6%
Contains
more
Other Other
+228.6%
Contains
more
Water Water
+14.3%
Fat Type Comparison
Fat type breakdown side-by-side comparison
2
13%
29%
58%
Saturated fat:
Sat. Fat
0.269 g
Monounsaturated fat:
Mono. Fat
0.583 g
Polyunsaturated fat:
Poly. Fat
1.156 g
1
26%
16%
59%
Saturated fat:
Sat. Fat
0.093 g
Monounsaturated fat:
Mono. Fat
0.057 g
Polyunsaturated fat:
Poly. Fat
0.214 g
Contains
more
Mono. Fat Monounsaturated fat
+922.8%
Contains
more
Poly. Fat Polyunsaturated fat
+440.2%
Contains
less
Sat. Fat Saturated fat
-65.4%