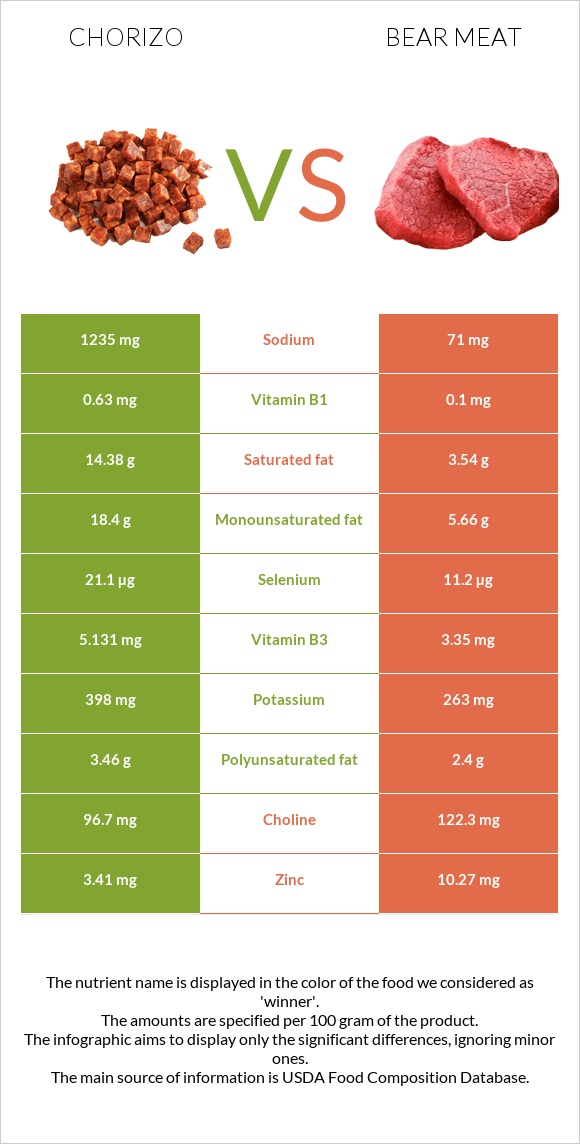
What are the main differences between chorizo and bear meat? Chorizo is richer in vitamin B1, vitamin B6, selenium, and vitamin B3, while bear meat is higher in iron, zinc, vitamin B2, and vitamin B12. Bear meat's daily need coverage for iron is 114% higher. Bear meat has 17 times less sodium than chorizo. Chorizo has 1235mg of sodium, while bear meat has 71mg. Chorizo has a higher glycemic index (28) than bear meat (0). We used Chorizo, pork, and beef and Game meat, bear, cooked, simmered types in this comparison.
Infographic
Mineral Comparison
Mineral comparison score is based on the number of minerals by which one or the other food is richer. The "coverage" charts below show how much of the daily needs can be covered by 300 grams of the food.
4
100 g
300 g
1 oz - 28.35g 1 link (4" long) - 60g
Magnesium
Magnesium
Calcium
Calcium
Potassium
Potassium
Iron
Iron
Copper
Copper
Zinc
Zinc
Phosphorus
Phosphorus
Sodium
Sodium
Manganese
Manganese
Selenium
Selenium
13%
2.4%
35%
60%
27%
93%
64%
161%
5.2%
115%
6
100 g
300 g
3 oz - 85g 1 piece, cooked (yield from 1 lb raw meat, boneless) - 277g
Magnesium
Magnesium
Calcium
Calcium
Potassium
Potassium
Iron
Iron
Copper
Copper
Zinc
Zinc
Phosphorus
Phosphorus
Sodium
Sodium
Manganese
Manganese
Selenium
Selenium
16%
1.5%
23%
402%
49%
280%
73%
9.3%
0%
61%
Vitamin Comparison
Vitamin comparison score is based on the number of vitamins by which one or the other food is richer. The "coverage" charts below show how much of the daily needs can be covered by 300 grams of the food.
5
100 g
300 g
1 oz - 28.35g 1 link (4" long) - 60g
Vitamin C
Vit. C
Vitamin D
Vit. D
Vitamin A
Vit. A
Vitamin E
Vit. E
Vitamin B1
Vit. B1
Vitamin B2
Vit. B2
Vitamin B3
Vit. B3
Vitamin B5
Vit. B5
Vitamin B6
Vit. B6
Vitamin B12
Vit. B12
Vitamin K
Vit. K
Folate
Folate
0%
23%
0%
4.4%
158%
69%
96%
67%
122%
250%
4%
1.5%
5
100 g
300 g
3 oz - 85g 1 piece, cooked (yield from 1 lb raw meat, boneless) - 277g
Vitamin C
Vit. C
Vitamin D
Vit. D
Vitamin A
Vit. A
Vitamin E
Vit. E
Vitamin B1
Vit. B1
Vitamin B2
Vit. B2
Vitamin B3
Vit. B3
Vitamin B5
Vit. B5
Vitamin B6
Vit. B6
Vitamin B12
Vit. B12
Vitamin K
Vit. K
Folate
Folate
0%
0%
0%
9.8%
25%
189%
63%
0%
67%
309%
4.5%
4.5%
All nutrients comparison - raw data values
Nutrient
DV% diff.
Iron
1.59mg
10.73mg
114%
Zinc
3.41mg
10.27mg
62%
Sodium
1235mg
71mg
51%
Saturated fat
14.38g
3.54g
49%
Vitamin B1
0.63mg
0.1mg
44%
Vitamin B2
0.3mg
0.82mg
40%
Fats
38.27g
13.39g
38%
Monounsaturated fat
18.4g
5.66g
32%
Vitamin B5
1.12mg
22%
Vitamin B12
2µg
2.47µg
20%
Selenium
21.1µg
11.2µg
18%
Vitamin B6
0.53mg
0.29mg
18%
Protein
24.1g
32.42g
17%
Vitamin B3
5.131mg
3.35mg
11%
Calories
455kcal
259kcal
10%
Vitamin D*
61 IU
0 IU
8%
Vitamin D
1.5µg
0µg
8%
Copper
0.08mg
0.148mg
8%
Polyunsaturated fat
3.46g
2.4g
7%
Choline
96.7mg
122.3mg
5%
Potassium
398mg
263mg
4%
Cholesterol
88mg
98mg
3%
Phosphorus
150mg
170mg
3%
Vitamin E
0.22mg
0.49mg
2%
Manganese
0.04mg
2%
Carbs
1.86g
0g
1%
Magnesium
18mg
23mg
1%
Folate
2µg
6µg
1%
Protein per 100 calories
5.3g
13g
N/A
Calories per 10 g protein
189kcal
80kcal
N/A
Weight per 100 calories
22g
39g
N/A
Unsaturated / Saturated Fat ratio
1.5
2.3
N/A
Net carbs
1.86g
0g
N/A
Calcium
8mg
5mg
0%
Vitamin K
1.6µg
1.8µg
0%
Tryptophan
0.278mg
0%
Threonine
1.473mg
0%
Isoleucine
2.206mg
0%
Leucine
1.708mg
0%
Lysine
2.414mg
0%
Methionine
0.47mg
0%
Phenylalanine
1.149mg
0%
Valine
0.914mg
0%
Histidine
0.721mg
0%
Omega-3 - DHA
0g
0.037g
N/A
Omega-3 - DPA
0g
0.034g
N/A
Macronutrient Comparison
Macronutrient breakdown side-by-side comparison
3
24%
38%
2%
32%
4%
Protein:
24.1 g
Fats:
38.27 g
Carbs:
1.86 g
Water:
31.85 g
Other:
3.92 g
2
32%
13%
54%
Protein:
32.42 g
Fats:
13.39 g
Carbs:
0 g
Water:
53.55 g
Other:
0.64 g
Contains
more
Fats Fats
+185.8%
Contains
more
Carbs Carbs
+∞%
Contains
more
Other Other
+512.5%
Contains
more
Protein Protein
+34.5%
Contains
more
Water Water
+68.1%
Fat Type Comparison
Fat type breakdown side-by-side comparison
2
40%
51%
10%
Saturated fat:
Sat. Fat
14.38 g
Monounsaturated fat:
Mono. Fat
18.4 g
Polyunsaturated fat:
Poly. Fat
3.46 g
1
31%
49%
21%
Saturated fat:
Sat. Fat
3.54 g
Monounsaturated fat:
Mono. Fat
5.66 g
Polyunsaturated fat:
Poly. Fat
2.4 g
Contains
more
Mono. Fat Monounsaturated fat
+225.1%
Contains
more
Poly. Fat Polyunsaturated fat
+44.2%
Contains
less
Sat. Fat Saturated fat
-75.4%