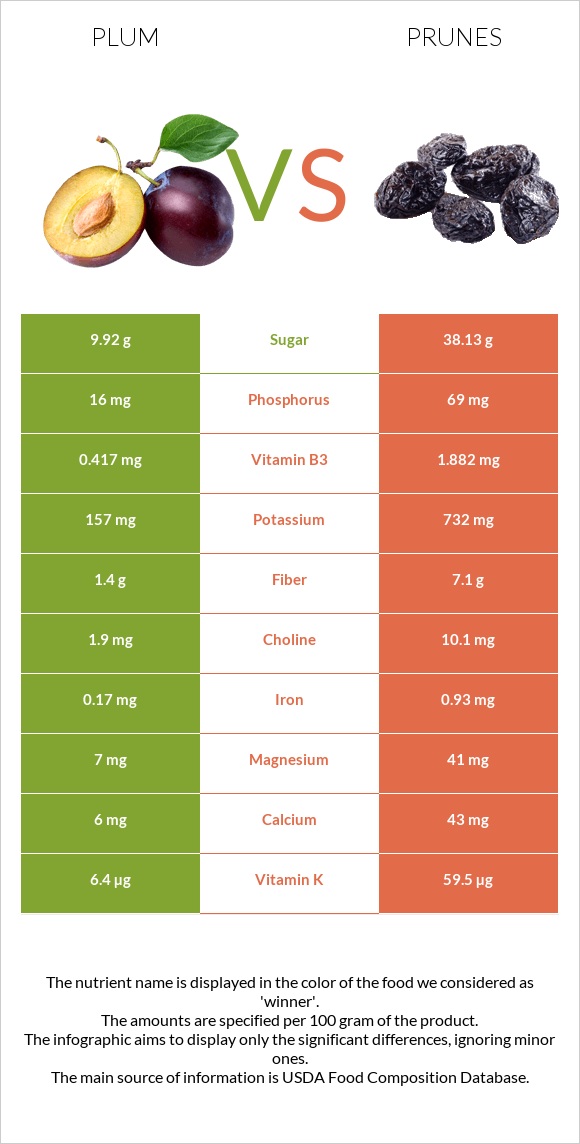
Significant differences between plums and prunes Plums have more vitamin C; however, prunes are richer in vitamin K, copper, fiber, potassium, vitamin B6, vitamin B2, manganese, iron, and vitamin B3. Prunes cover your daily vitamin K needs 44% more than plums. Prunes have 16 times less vitamin C than plums. Plums have 9.5mg of vitamin C, while prunes have 0.6mg. Plums have a higher glycemic index. The glycemic index of plums is 53, while the glycemic index of prunes is 29. Specific food types used in this comparison are Plums, raw and Plums, dried (prunes), uncooked .
Infographic
Mineral Comparison
Mineral comparison score is based on the number of minerals by which one or the other food is richer. The "coverage" charts below show how much of the daily needs can be covered by 300 grams of the food.
1
100 g
300 g
1 fruit (2-1/8" dia) - 66g 1 NLEA serving - 151g 1 cup, sliced - 165g
Magnesium
Magnesium
Calcium
Calcium
Potassium
Potassium
Iron
Iron
Copper
Copper
Zinc
Zinc
Phosphorus
Phosphorus
Sodium
Sodium
Manganese
Manganese
Selenium
Selenium
5%
1.8%
14%
6.4%
19%
2.7%
6.9%
0%
6.8%
0%
9
100 g
300 g
1 prune, pitted - 9.5g 1 cup, pitted - 174g
Magnesium
Magnesium
Calcium
Calcium
Potassium
Potassium
Iron
Iron
Copper
Copper
Zinc
Zinc
Phosphorus
Phosphorus
Sodium
Sodium
Manganese
Manganese
Selenium
Selenium
29%
13%
65%
35%
94%
12%
30%
0.26%
39%
1.6%
Vitamin Comparison
Vitamin comparison score is based on the number of vitamins by which one or the other food is richer. The "coverage" charts below show how much of the daily needs can be covered by 300 grams of the food.
2
100 g
300 g
1 fruit (2-1/8" dia) - 66g 1 NLEA serving - 151g 1 cup, sliced - 165g
Vitamin C
Vit. C
Vitamin D
Vit. D
Vitamin A
Vit. A
Vitamin E
Vit. E
Vitamin B1
Vit. B1
Vitamin B2
Vit. B2
Vitamin B3
Vit. B3
Vitamin B5
Vit. B5
Vitamin B6
Vit. B6
Vitamin B12
Vit. B12
Vitamin K
Vit. K
Folate
Folate
32%
0%
5.7%
5.2%
7%
6%
7.8%
8.1%
6.7%
0%
16%
3.8%
8
100 g
300 g
1 prune, pitted - 9.5g 1 cup, pitted - 174g
Vitamin C
Vit. C
Vitamin D
Vit. D
Vitamin A
Vit. A
Vitamin E
Vit. E
Vitamin B1
Vit. B1
Vitamin B2
Vit. B2
Vitamin B3
Vit. B3
Vitamin B5
Vit. B5
Vitamin B6
Vit. B6
Vitamin B12
Vit. B12
Vitamin K
Vit. K
Folate
Folate
2%
0%
13%
8.6%
13%
43%
35%
25%
47%
0%
149%
3%
All nutrients comparison - raw data values
Nutrient
DV% diff.
Vitamin K
6.4µg
59.5µg
44%
Copper
0.057mg
0.281mg
25%
Fiber
1.4g
7.1g
23%
Carbs
11.42g
63.88g
17%
Potassium
157mg
732mg
17%
Vitamin B6
0.029mg
0.205mg
14%
Vitamin B2
0.026mg
0.186mg
12%
Fructose
3.07g
12.45g
12%
Manganese
0.052mg
0.299mg
11%
Calories
46kcal
240kcal
10%
Vitamin C
9.5mg
0.6mg
10%
Iron
0.17mg
0.93mg
10%
Vitamin B3
0.417mg
1.882mg
9%
Magnesium
7mg
41mg
8%
Phosphorus
16mg
69mg
8%
Vitamin B5
0.135mg
0.422mg
6%
Calcium
6mg
43mg
4%
Protein
0.7g
2.18g
3%
Zinc
0.1mg
0.44mg
3%
Starch
0g
5.11g
2%
Vitamin A
17µg
39µg
2%
Vitamin B1
0.028mg
0.051mg
2%
Vitamin E
0.26mg
0.43mg
1%
Selenium
0µg
0.3µg
1%
Choline
1.9mg
10.1mg
1%
Protein per 100 calories
1.5g
0.91g
N/A
Calories per 10 g protein
657kcal
1101kcal
N/A
Weight per 100 calories
217g
42g
N/A
Fats
0.28g
0.38g
0%
Net carbs
10.02g
56.78g
N/A
Sugar
9.92g
38.13g
N/A
Sodium
0mg
2mg
0%
Folate
5µg
4µg
0%
Saturated fat
0.017g
0.088g
0%
Monounsaturated fat
0.134g
0.053g
0%
Polyunsaturated fat
0.044g
0.062g
0%
Tryptophan
0.009mg
0.025mg
0%
Threonine
0.01mg
0.049mg
0%
Isoleucine
0.014mg
0.041mg
0%
Leucine
0.015mg
0.066mg
0%
Lysine
0.016mg
0.05mg
0%
Methionine
0.008mg
0.016mg
0%
Phenylalanine
0.014mg
0.052mg
0%
Valine
0.016mg
0.056mg
0%
Histidine
0.009mg
0.027mg
0%
Macronutrient Comparison
Macronutrient breakdown side-by-side comparison
1
11%
87%
Protein:
0.7 g
Fats:
0.28 g
Carbs:
11.42 g
Water:
87.23 g
Other:
0.37 g
4
2%
64%
31%
3%
Protein:
2.18 g
Fats:
0.38 g
Carbs:
63.88 g
Water:
30.92 g
Other:
2.64 g
Contains
more
Water Water
+182.1%
Contains
more
Protein Protein
+211.4%
Contains
more
Fats Fats
+35.7%
Contains
more
Carbs Carbs
+459.4%
Contains
more
Other Other
+613.5%
Fat Type Comparison
Fat type breakdown side-by-side comparison
2
9%
69%
23%
Saturated fat:
Sat. Fat
0.017 g
Monounsaturated fat:
Mono. Fat
0.134 g
Polyunsaturated fat:
Poly. Fat
0.044 g
1
43%
26%
31%
Saturated fat:
Sat. Fat
0.088 g
Monounsaturated fat:
Mono. Fat
0.053 g
Polyunsaturated fat:
Poly. Fat
0.062 g
Contains
less
Sat. Fat Saturated fat
-80.7%
Contains
more
Mono. Fat Monounsaturated fat
+152.8%
Contains
more
Poly. Fat Polyunsaturated fat
+40.9%
Carbohydrate type comparison
Carbohydrate type breakdown side-by-side comparison
3
16%
51%
31%
Starch:
0 g
Sucrose:
1.57 g
Glucose:
5.07 g
Fructose:
3.07 g
Lactose:
0 g
Maltose:
0.08 g
Galactose:
0.14 g
3
12%
59%
29%
Starch:
5.11 g
Sucrose:
0.15 g
Glucose:
25.46 g
Fructose:
12.45 g
Lactose:
0 g
Maltose:
0.06 g
Galactose:
0 g
Contains
more
Sucrose Sucrose
+946.7%
Contains
more
Maltose Maltose
+33.3%
Contains
more
Galactose Galactose
+∞%
Contains
more
Starch Starch
+∞%
Contains
more
Glucose Glucose
+402.2%
Contains
more
Fructose Fructose
+305.5%