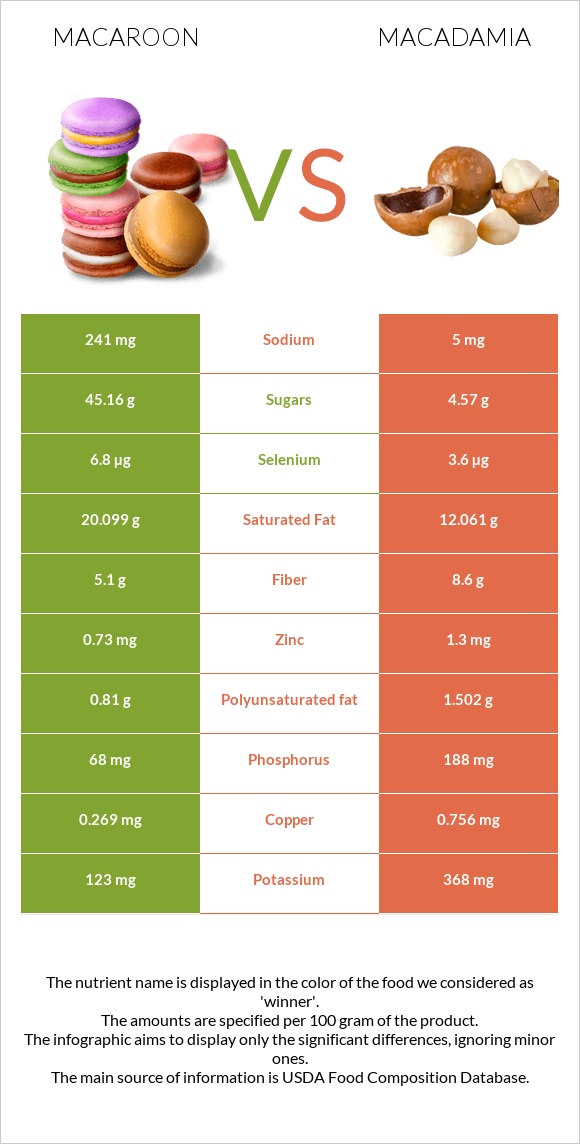
Significant differences between macaroon and macadamia The amount of vitamin B1, copper, iron, magnesium, phosphorus, vitamin B3, fiber, and vitamin B6 in macadamia is higher than in macaroon. Macadamia covers your daily vitamin B1 needs 98% more than macaroon. Macadamia has 48 times less sodium than macaroon. Macaroon has 241mg of sodium, while macadamia has 5mg. Macaroon has a higher glycemic index. The glycemic index of macaroon is 32, while the glycemic index of macadamia is 10. Specific food types used in this comparison are Cookies, coconut macaroon and Nuts, macadamia nuts, raw .
Infographic
Mineral Comparison
Mineral comparison score is based on the number of minerals by which one or the other food is richer. The "coverage" charts below show how much of the daily needs can be covered by 300 grams of the food.
1
100 g
300 g
2 cookie 1 serving - 36g
Magnesium
Magnesium
Calcium
Calcium
Potassium
Potassium
Iron
Iron
Copper
Copper
Zinc
Zinc
Phosphorus
Phosphorus
Sodium
Sodium
Manganese
Manganese
Selenium
Selenium
21%
1.5%
11%
31%
90%
20%
29%
31%
0%
37%
9
100 g
300 g
1 oz (10-12 kernels) - 28.35g 1 cup, whole or halves - 134g
Magnesium
Magnesium
Calcium
Calcium
Potassium
Potassium
Iron
Iron
Copper
Copper
Zinc
Zinc
Phosphorus
Phosphorus
Sodium
Sodium
Manganese
Manganese
Selenium
Selenium
93%
26%
32%
138%
252%
35%
81%
0.65%
539%
20%
Vitamin Comparison
Vitamin comparison score is based on the number of vitamins by which one or the other food is richer. The "coverage" charts below show how much of the daily needs can be covered by 300 grams of the food.
1
100 g
300 g
2 cookie 1 serving - 36g
Vitamin C
Vit. C
Vitamin D
Vit. D
Vitamin A
Vit. A
Vitamin E
Vit. E
Vitamin B1
Vit. B1
Vitamin B2
Vit. B2
Vitamin B3
Vit. B3
Vitamin B5
Vit. B5
Vitamin B6
Vit. B6
Vitamin B12
Vit. B12
Vitamin K
Vit. K
Folate
Folate
0%
0%
0%
3.8%
5%
14%
4.1%
0%
22%
0%
2.8%
2.3%
8
100 g
300 g
1 oz (10-12 kernels) - 28.35g 1 cup, whole or halves - 134g
Vitamin C
Vit. C
Vitamin D
Vit. D
Vitamin A
Vit. A
Vitamin E
Vit. E
Vitamin B1
Vit. B1
Vitamin B2
Vit. B2
Vitamin B3
Vit. B3
Vitamin B5
Vit. B5
Vitamin B6
Vit. B6
Vitamin B12
Vit. B12
Vitamin K
Vit. K
Folate
Folate
4%
0%
0%
11%
299%
37%
46%
45%
63%
0%
0%
8.3%
All nutrients comparison - raw data values
Nutrient
DV% diff.
Manganese
4.131mg
180%
Monounsaturated fat
1.61g
58.877g
143%
Vitamin B1
0.02mg
1.195mg
98%
Fats
22.55g
75.77g
82%
Copper
0.269mg
0.756mg
54%
Saturated fat
20.099g
12.061g
37%
Iron
0.82mg
3.69mg
36%
Magnesium
29mg
130mg
24%
Phosphorus
68mg
188mg
17%
Carbs
61.22g
13.82g
16%
Vitamin B5
0.758mg
15%
Fiber
5.1g
8.6g
14%
Vitamin B3
0.22mg
2.473mg
14%
Vitamin B6
0.096mg
0.275mg
14%
Calories
460kcal
718kcal
13%
Protein
3.02g
7.91g
10%
Sodium
241mg
5mg
10%
Calcium
5mg
85mg
8%
Vitamin B2
0.06mg
0.162mg
8%
Potassium
123mg
368mg
7%
Selenium
6.8µg
3.6µg
6%
Zinc
0.73mg
1.3mg
5%
Polyunsaturated fat
0.81g
1.502g
5%
Vitamin E
0.19mg
0.54mg
2%
Folate
3µg
11µg
2%
Choline
9.1mg
2%
Vitamin C
0mg
1.2mg
1%
Vitamin K
1.1µg
1%
Protein per 100 calories
0.66g
1.1g
N/A
Calories per 10 g protein
1523kcal
908kcal
N/A
Weight per 100 calories
22g
14g
N/A
Unsaturated / Saturated Fat ratio
0.12
5
N/A
Net carbs
56.12g
5.22g
N/A
Sugar
45.16g
4.57g
N/A
Starch
1.05g
0%
Tryptophan
0.067mg
0%
Threonine
0.37mg
0%
Isoleucine
0.314mg
0%
Leucine
0.602mg
0%
Lysine
0.018mg
0%
Methionine
0.023mg
0%
Phenylalanine
0.665mg
0%
Valine
0.363mg
0%
Histidine
0.195mg
0%
Fructose
0.07g
0%
Macronutrient Comparison
Macronutrient breakdown side-by-side comparison
3
3%
23%
61%
12%
2%
Protein:
3.02 g
Fats:
22.55 g
Carbs:
61.22 g
Water:
11.5 g
Other:
1.71 g
2
8%
76%
14%
Protein:
7.91 g
Fats:
75.77 g
Carbs:
13.82 g
Water:
1.36 g
Other:
1.14 g
Contains
more
Carbs Carbs
+343%
Contains
more
Water Water
+745.6%
Contains
more
Other Other
+50%
Contains
more
Protein Protein
+161.9%
Contains
more
Fats Fats
+236%
Fat Type Comparison
Fat type breakdown side-by-side comparison
0
89%
7%
4%
Saturated fat:
Sat. Fat
20.099 g
Monounsaturated fat:
Mono. Fat
1.61 g
Polyunsaturated fat:
Poly. Fat
0.81 g
3
17%
81%
2%
Saturated fat:
Sat. Fat
12.061 g
Monounsaturated fat:
Mono. Fat
58.877 g
Polyunsaturated fat:
Poly. Fat
1.502 g
Contains
less
Sat. Fat Saturated fat
-40%
Contains
more
Mono. Fat Monounsaturated fat
+3557%
Contains
more
Poly. Fat Polyunsaturated fat
+85.4%