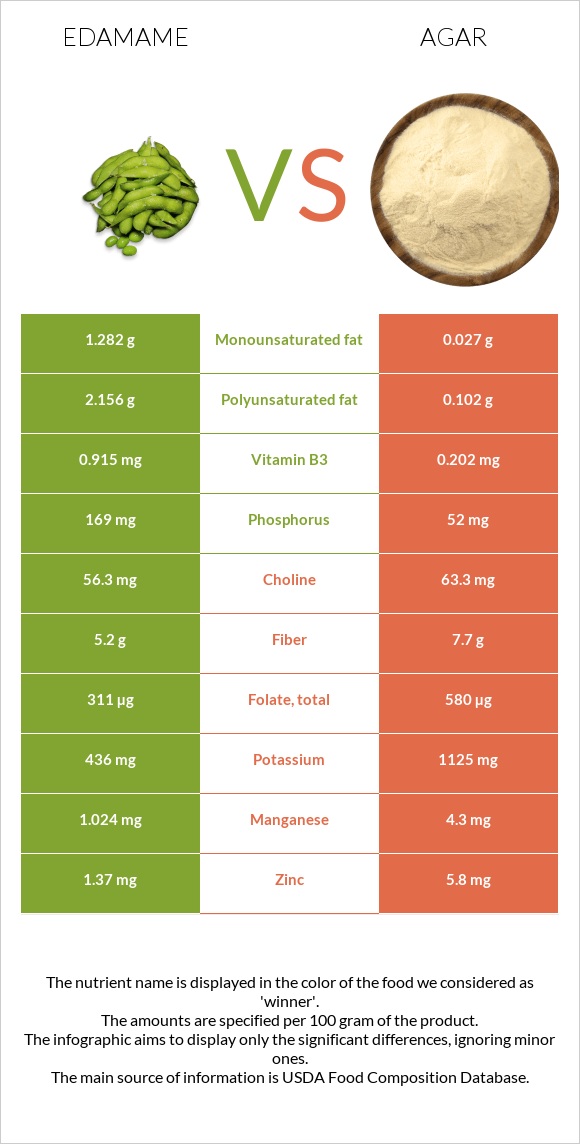
A recap on the differences between edamame and agar Edamame has less iron, magnesium, manganese, folate, calcium, vitamin B5, zinc, copper, vitamin E, and potassium. Agar covers your daily iron needs 239% more than edamame. Food varieties used in this article are Edamame, frozen, prepared and Seaweed, agar, dried .
Infographic
Mineral Comparison
Mineral comparison score is based on the number of minerals by which one or the other food is richer. The "coverage" charts below show how much of the daily needs can be covered by 300 grams of the food.
2
100 g
300 g
1 cup - 155g
Magnesium
Magnesium
Calcium
Calcium
Potassium
Potassium
Iron
Iron
Copper
Copper
Zinc
Zinc
Phosphorus
Phosphorus
Sodium
Sodium
Manganese
Manganese
Selenium
Selenium
46%
19%
38%
85%
115%
37%
72%
0.78%
134%
4.4%
8
100 g
300 g
Magnesium
Magnesium
Calcium
Calcium
Potassium
Potassium
Iron
Iron
Copper
Copper
Zinc
Zinc
Phosphorus
Phosphorus
Sodium
Sodium
Manganese
Manganese
Selenium
Selenium
550%
188%
99%
803%
203%
158%
22%
13%
561%
40%
Vitamin Comparison
Vitamin comparison score is based on the number of vitamins by which one or the other food is richer. The "coverage" charts below show how much of the daily needs can be covered by 300 grams of the food.
4
100 g
300 g
1 cup - 155g
Vitamin C
Vit. C
Vitamin D
Vit. D
Vitamin A
Vit. A
Vitamin E
Vit. E
Vitamin B1
Vit. B1
Vitamin B2
Vit. B2
Vitamin B3
Vit. B3
Vitamin B5
Vit. B5
Vitamin B6
Vit. B6
Vitamin B12
Vit. B12
Vitamin K
Vit. K
Folate
Folate
20%
0%
5%
14%
50%
36%
17%
24%
23%
0%
67%
233%
5
100 g
300 g
Vitamin C
Vit. C
Vitamin D
Vit. D
Vitamin A
Vit. A
Vitamin E
Vit. E
Vitamin B1
Vit. B1
Vitamin B2
Vit. B2
Vitamin B3
Vit. B3
Vitamin B5
Vit. B5
Vitamin B6
Vit. B6
Vitamin B12
Vit. B12
Vitamin K
Vit. K
Folate
Folate
0%
0%
0%
100%
2.5%
51%
3.8%
181%
70%
0%
61%
435%
All nutrients comparison - raw data values
Nutrient
DV% diff.
Iron
2.27mg
21.4mg
239%
Magnesium
64mg
770mg
168%
Manganese
1.024mg
4.3mg
142%
Folate
311µg
580µg
67%
Calcium
63mg
625mg
56%
Vitamin B5
0.395mg
3.018mg
52%
Zinc
1.37mg
5.8mg
40%
Copper
0.345mg
0.61mg
29%
Vitamin E
0.68mg
5mg
29%
Carbs
8.91g
80.88g
24%
Potassium
436mg
1125mg
20%
Phosphorus
169mg
52mg
17%
Vitamin B1
0.2mg
0.01mg
16%
Vitamin B6
0.1mg
0.303mg
16%
Polyunsaturated fat
2.156g
0.102g
14%
Selenium
0.8µg
7.4µg
12%
Protein
11.91g
6.21g
11%
Fiber
5.2g
7.7g
10%
Calories
121kcal
306kcal
9%
Fats
5.2g
0.3g
8%
Vitamin C
6.1mg
0mg
7%
Vitamin B2
0.155mg
0.222mg
5%
Sodium
6mg
102mg
4%
Vitamin B3
0.915mg
0.202mg
4%
Saturated fat
0.62g
0.061g
3%
Monounsaturated fat
1.282g
0.027g
3%
Vitamin A
15µg
0µg
2%
Vitamin K
26.7µg
24.4µg
2%
Starch
1.51g
1%
Choline
56.3mg
63.3mg
1%
Protein per 100 calories
9.8g
2g
N/A
Calories per 10 g protein
102kcal
493kcal
N/A
Weight per 100 calories
83g
33g
N/A
Unsaturated / Saturated Fat ratio
5.5
2.1
N/A
Net carbs
3.71g
73.18g
N/A
Sugar
2.18g
2.97g
N/A
Trans fat
0.009g
0g
N/A
Tryptophan
0.126mg
0%
Threonine
0.331mg
0%
Isoleucine
0.3mg
0%
Leucine
0.745mg
0%
Lysine
0.745mg
0%
Methionine
0.141mg
0%
Phenylalanine
0.488mg
0%
Valine
0.324mg
0%
Histidine
0.267mg
0%
Fructose
0.12g
0%
Omega-3 - EPA
0.003g
0.087g
N/A
Omega-3 - ALA
0.358g
N/A
Omega-6 - Eicosadienoic acid
0.002g
N/A
Omega-6 - Linoleic acid
1.789g
N/A
Macronutrient Comparison
Macronutrient breakdown side-by-side comparison
3
12%
5%
9%
73%
Protein:
11.91 g
Fats:
5.2 g
Carbs:
8.91 g
Water:
72.77 g
Other:
1.21 g
2
6%
81%
9%
4%
Protein:
6.21 g
Fats:
0.3 g
Carbs:
80.88 g
Water:
8.68 g
Other:
3.93 g
Contains
more
Protein Protein
+91.8%
Contains
more
Fats Fats
+1633.3%
Contains
more
Water Water
+738.4%
Contains
more
Carbs Carbs
+807.7%
Contains
more
Other Other
+224.8%
Fat Type Comparison
Fat type breakdown side-by-side comparison
2
15%
32%
53%
Saturated fat:
Sat. Fat
0.62 g
Monounsaturated fat:
Mono. Fat
1.282 g
Polyunsaturated fat:
Poly. Fat
2.156 g
1
32%
14%
54%
Saturated fat:
Sat. Fat
0.061 g
Monounsaturated fat:
Mono. Fat
0.027 g
Polyunsaturated fat:
Poly. Fat
0.102 g
Contains
more
Mono. Fat Monounsaturated fat
+4648.1%
Contains
more
Poly. Fat Polyunsaturated fat
+2013.7%
Contains
less
Sat. Fat Saturated fat
-90.2%