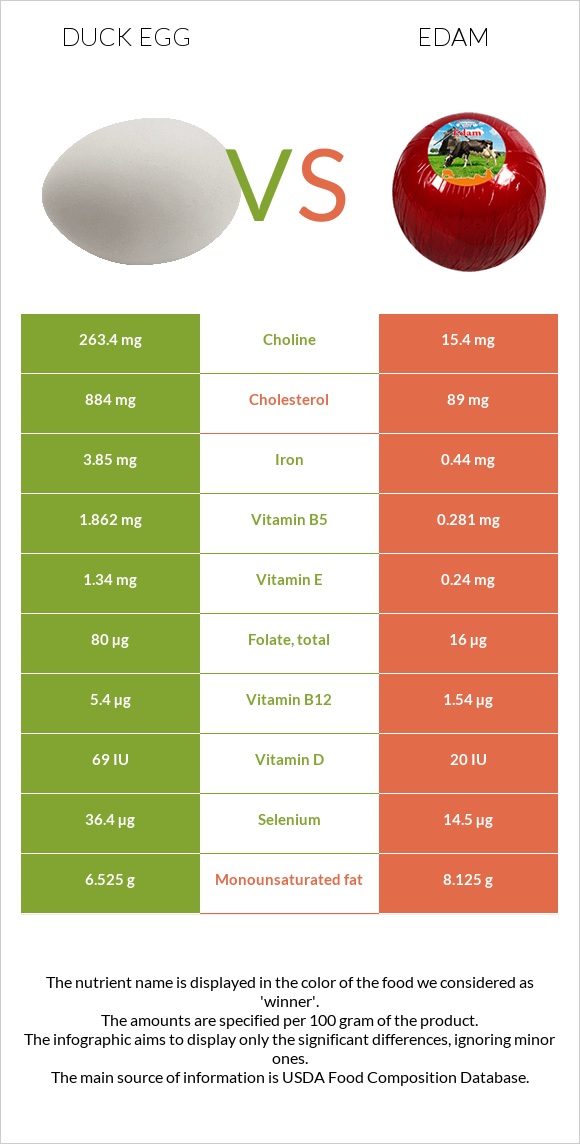
What are the main differences between duck eggs and edam? Duck eggs are richer in vitamin B12, choline, iron, selenium, and vitamin B5, while edam is higher in calcium and phosphorus. Duck eggs' daily need coverage for cholesterol is 265% higher. Edam has 17 times less choline than duck eggs. Duck eggs have 263.4mg of choline, while edam has 15.4mg. Edam is lower in cholesterol. We used Egg, duck, whole, fresh, raw and Cheese, edam types in this comparison.
Infographic
Mineral Comparison
Mineral comparison score is based on the number of minerals by which one or the other food is richer. The "coverage" charts below show how much of the daily needs can be covered by 300 grams of the food.
6
100 g
300 g
1 egg - 70g
Magnesium
Magnesium
Calcium
Calcium
Potassium
Potassium
Iron
Iron
Copper
Copper
Zinc
Zinc
Phosphorus
Phosphorus
Sodium
Sodium
Manganese
Manganese
Selenium
Selenium
12%
19%
20%
144%
21%
38%
94%
19%
5%
199%
4
100 g
300 g
1 oz - 28.35g 1 package (7 oz) - 198g
Magnesium
Magnesium
Calcium
Calcium
Potassium
Potassium
Iron
Iron
Copper
Copper
Zinc
Zinc
Phosphorus
Phosphorus
Sodium
Sodium
Manganese
Manganese
Selenium
Selenium
21%
219%
17%
17%
12%
102%
230%
106%
1.4%
79%
Vitamin Comparison
Vitamin comparison score is based on the number of vitamins by which one or the other food is richer. The "coverage" charts below show how much of the daily needs can be covered by 300 grams of the food.
8
100 g
300 g
1 egg - 70g
Vitamin C
Vit. C
Vitamin D
Vit. D
Vitamin A
Vit. A
Vitamin E
Vit. E
Vitamin B1
Vit. B1
Vitamin B2
Vit. B2
Vitamin B3
Vit. B3
Vitamin B5
Vit. B5
Vitamin B6
Vit. B6
Vitamin B12
Vit. B12
Vitamin K
Vit. K
Folate
Folate
0%
26%
65%
27%
39%
93%
3.8%
112%
58%
675%
1%
60%
2
100 g
300 g
1 oz - 28.35g 1 package (7 oz) - 198g
Vitamin C
Vit. C
Vitamin D
Vit. D
Vitamin A
Vit. A
Vitamin E
Vit. E
Vitamin B1
Vit. B1
Vitamin B2
Vit. B2
Vitamin B3
Vit. B3
Vitamin B5
Vit. B5
Vitamin B6
Vit. B6
Vitamin B12
Vit. B12
Vitamin K
Vit. K
Folate
Folate
0%
7.5%
81%
4.8%
9.3%
90%
1.5%
17%
18%
193%
5.8%
12%
All nutrients comparison - raw data values
Nutrient
DV% diff.
Cholesterol
884mg
89mg
265%
Vitamin B12
5.4µg
1.54µg
161%
Calcium
64mg
731mg
67%
Saturated fat
3.681g
17.572g
63%
Phosphorus
220mg
536mg
45%
Choline
263.4mg
15.4mg
45%
Iron
3.85mg
0.44mg
43%
Selenium
36.4µg
14.5µg
40%
Vitamin B5
1.862mg
0.281mg
32%
Sodium
146mg
812mg
29%
Protein
12.81g
24.99g
24%
Fats
13.77g
27.8g
22%
Zinc
1.41mg
3.75mg
21%
Folate
80µg
16µg
16%
Vitamin B6
0.25mg
0.076mg
13%
Vitamin B1
0.156mg
0.037mg
10%
Calories
185kcal
357kcal
9%
Vitamin E
1.34mg
0.24mg
7%
Vitamin D*
69 IU
20 IU
6%
Vitamin D
1.7µg
0.5µg
6%
Vitamin A
194µg
243µg
5%
Monounsaturated fat
6.525g
8.125g
4%
Polyunsaturated fat
1.223g
0.665g
4%
Magnesium
17mg
30mg
3%
Copper
0.062mg
0.036mg
3%
Vitamin K
0.4µg
2.3µg
2%
Potassium
222mg
188mg
1%
Manganese
0.038mg
0.011mg
1%
Vitamin B2
0.404mg
0.389mg
1%
Vitamin B3
0.2mg
0.082mg
1%
Protein per 100 calories
6.9g
7g
N/A
Calories per 10 g protein
144kcal
143kcal
N/A
Weight per 100 calories
54g
28g
N/A
Unsaturated / Saturated Fat ratio
2.1
0.5
N/A
Net carbs
1.45g
1.43g
N/A
Carbs
1.45g
1.43g
0%
Sugar
0.93g
1.43g
N/A
Tryptophan
0.26mg
0.352mg
0%
Threonine
0.736mg
0.932mg
0%
Isoleucine
0.598mg
1.308mg
0%
Leucine
1.097mg
2.57mg
0%
Lysine
0.951mg
2.66mg
0%
Methionine
0.576mg
0.721mg
0%
Phenylalanine
0.84mg
1.434mg
0%
Valine
0.885mg
1.81mg
0%
Histidine
0.32mg
1.034mg
0%
Macronutrient Comparison
Macronutrient breakdown side-by-side comparison
2
13%
14%
71%
Protein:
12.81 g
Fats:
13.77 g
Carbs:
1.45 g
Water:
70.83 g
Other:
1.14 g
3
25%
28%
42%
4%
Protein:
24.99 g
Fats:
27.8 g
Carbs:
1.43 g
Water:
41.56 g
Other:
4.22 g
Contains
more
Water Water
+70.4%
Contains
more
Protein Protein
+95.1%
Contains
more
Fats Fats
+101.9%
Contains
more
Other Other
+270.2%
Fat Type Comparison
Fat type breakdown side-by-side comparison
2
32%
57%
11%
Saturated fat:
Sat. Fat
3.681 g
Monounsaturated fat:
Mono. Fat
6.525 g
Polyunsaturated fat:
Poly. Fat
1.223 g
1
67%
31%
3%
Saturated fat:
Sat. Fat
17.572 g
Monounsaturated fat:
Mono. Fat
8.125 g
Polyunsaturated fat:
Poly. Fat
0.665 g
Contains
less
Sat. Fat Saturated fat
-79.1%
Contains
more
Poly. Fat Polyunsaturated fat
+83.9%
Contains
more
Mono. Fat Monounsaturated fat
+24.5%