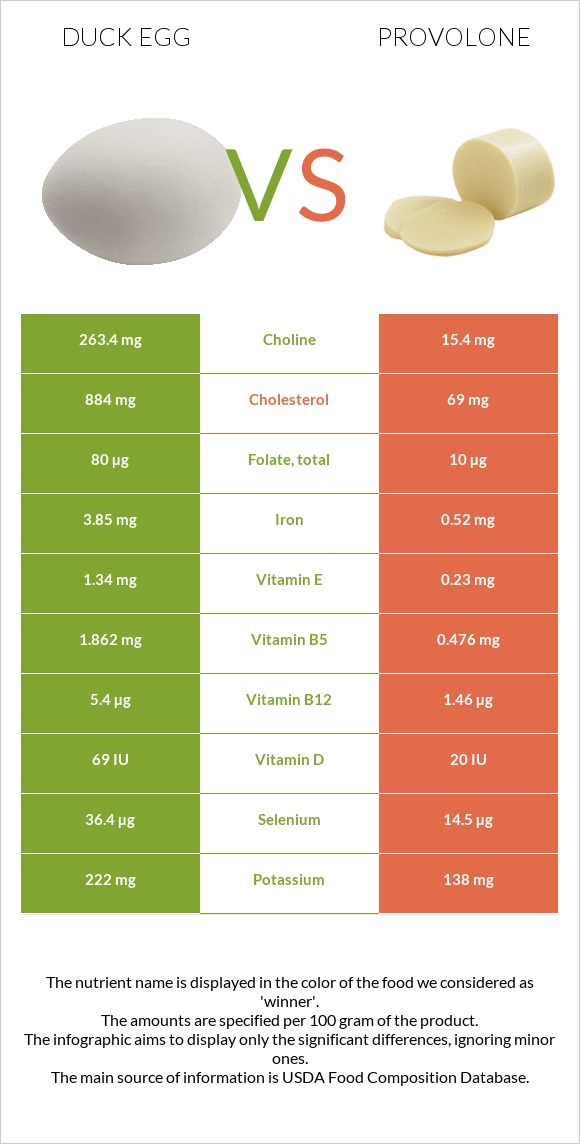
Summary of differences between duck eggs and provolone Duck eggs have more vitamin B12, choline, iron, selenium, and vitamin B5; however, provolone is higher in calcium and phosphorus. Duck eggs cover your daily need for cholesterol, 272% more than provolone. Duck eggs have 17 times more choline than provolone. While duck eggs have 263.4mg of choline, provolone has only 15.4mg. Provolone has less cholesterol. These are the specific foods used in this comparison Egg, duck, whole, fresh, raw and Cheese, provolone .
Infographic
Mineral Comparison
Mineral comparison score is based on the number of minerals by which one or the other food is richer. The "coverage" charts below show how much of the daily needs can be covered by 300 grams of the food.
6
100 g
300 g
1 egg - 70g
Magnesium
Magnesium
Calcium
Calcium
Potassium
Potassium
Iron
Iron
Copper
Copper
Zinc
Zinc
Phosphorus
Phosphorus
Sodium
Sodium
Manganese
Manganese
Selenium
Selenium
12%
19%
20%
144%
21%
38%
94%
19%
5%
199%
4
100 g
300 g
1 cubic inch - 17g 1 slice (1 oz) - 28g 1 oz - 28.35g 1 cup, diced - 132g 1 package (6 oz) - 170g
Magnesium
Magnesium
Calcium
Calcium
Potassium
Potassium
Iron
Iron
Copper
Copper
Zinc
Zinc
Phosphorus
Phosphorus
Sodium
Sodium
Manganese
Manganese
Selenium
Selenium
20%
227%
12%
20%
8.7%
88%
213%
114%
1.3%
79%
Vitamin Comparison
Vitamin comparison score is based on the number of vitamins by which one or the other food is richer. The "coverage" charts below show how much of the daily needs can be covered by 300 grams of the food.
9
100 g
300 g
1 egg - 70g
Vitamin C
Vit. C
Vitamin D
Vit. D
Vitamin A
Vit. A
Vitamin E
Vit. E
Vitamin B1
Vit. B1
Vitamin B2
Vit. B2
Vitamin B3
Vit. B3
Vitamin B5
Vit. B5
Vitamin B6
Vit. B6
Vitamin B12
Vit. B12
Vitamin K
Vit. K
Folate
Folate
0%
26%
65%
27%
39%
93%
3.8%
112%
58%
675%
1%
60%
2
100 g
300 g
1 cubic inch - 17g 1 slice (1 oz) - 28g 1 oz - 28.35g 1 cup, diced - 132g 1 package (6 oz) - 170g
Vitamin C
Vit. C
Vitamin D
Vit. D
Vitamin A
Vit. A
Vitamin E
Vit. E
Vitamin B1
Vit. B1
Vitamin B2
Vit. B2
Vitamin B3
Vit. B3
Vitamin B5
Vit. B5
Vitamin B6
Vit. B6
Vitamin B12
Vit. B12
Vitamin K
Vit. K
Folate
Folate
0%
7.5%
79%
4.6%
4.8%
74%
2.9%
29%
17%
183%
5.5%
7.5%
All nutrients comparison - raw data values
Nutrient
DV% diff.
Cholesterol
884mg
69mg
272%
Vitamin B12
5.4µg
1.46µg
164%
Calcium
64mg
756mg
69%
Saturated fat
3.681g
17.078g
61%
Choline
263.4mg
15.4mg
45%
Iron
3.85mg
0.52mg
42%
Selenium
36.4µg
14.5µg
40%
Phosphorus
220mg
496mg
39%
Sodium
146mg
876mg
32%
Vitamin B5
1.862mg
0.476mg
28%
Protein
12.81g
25.58g
26%
Fats
13.77g
26.62g
20%
Folate
80µg
10µg
18%
Zinc
1.41mg
3.23mg
17%
Vitamin B6
0.25mg
0.073mg
14%
Vitamin B1
0.156mg
0.019mg
11%
Calories
185kcal
351kcal
8%
Vitamin E
1.34mg
0.23mg
7%
Vitamin D*
69 IU
20 IU
6%
Vitamin D
1.7µg
0.5µg
6%
Vitamin B2
0.404mg
0.321mg
6%
Vitamin A
194µg
236µg
5%
Copper
0.062mg
0.026mg
4%
Magnesium
17mg
28mg
3%
Polyunsaturated fat
1.223g
0.769g
3%
Potassium
222mg
138mg
2%
Vitamin K
0.4µg
2.2µg
2%
Monounsaturated fat
6.525g
7.393g
2%
Manganese
0.038mg
0.01mg
1%
Protein per 100 calories
6.9g
7.3g
N/A
Calories per 10 g protein
144kcal
137kcal
N/A
Weight per 100 calories
54g
28g
N/A
Unsaturated / Saturated Fat ratio
2.1
0.48
N/A
Net carbs
1.45g
2.14g
N/A
Carbs
1.45g
2.14g
0%
Sugar
0.93g
0.56g
N/A
Vitamin B3
0.2mg
0.156mg
0%
Tryptophan
0.26mg
0.345mg
0%
Threonine
0.736mg
0.982mg
0%
Isoleucine
0.598mg
1.091mg
0%
Leucine
1.097mg
2.297mg
0%
Lysine
0.951mg
2.646mg
0%
Methionine
0.576mg
0.686mg
0%
Phenylalanine
0.84mg
1.287mg
0%
Valine
0.885mg
1.64mg
0%
Histidine
0.32mg
1.115mg
0%
Macronutrient Comparison
Macronutrient breakdown side-by-side comparison
1
13%
14%
71%
Protein:
12.81 g
Fats:
13.77 g
Carbs:
1.45 g
Water:
70.83 g
Other:
1.14 g
4
26%
27%
2%
41%
5%
Protein:
25.58 g
Fats:
26.62 g
Carbs:
2.14 g
Water:
40.95 g
Other:
4.71 g
Contains
more
Water Water
+73%
Contains
more
Protein Protein
+99.7%
Contains
more
Fats Fats
+93.3%
Contains
more
Carbs Carbs
+47.6%
Contains
more
Other Other
+313.2%
Fat Type Comparison
Fat type breakdown side-by-side comparison
2
32%
57%
11%
Saturated fat:
Sat. Fat
3.681 g
Monounsaturated fat:
Mono. Fat
6.525 g
Polyunsaturated fat:
Poly. Fat
1.223 g
1
68%
29%
3%
Saturated fat:
Sat. Fat
17.078 g
Monounsaturated fat:
Mono. Fat
7.393 g
Polyunsaturated fat:
Poly. Fat
0.769 g
Contains
less
Sat. Fat Saturated fat
-78.4%
Contains
more
Poly. Fat Polyunsaturated fat
+59%
Contains
more
Mono. Fat Monounsaturated fat
+13.3%