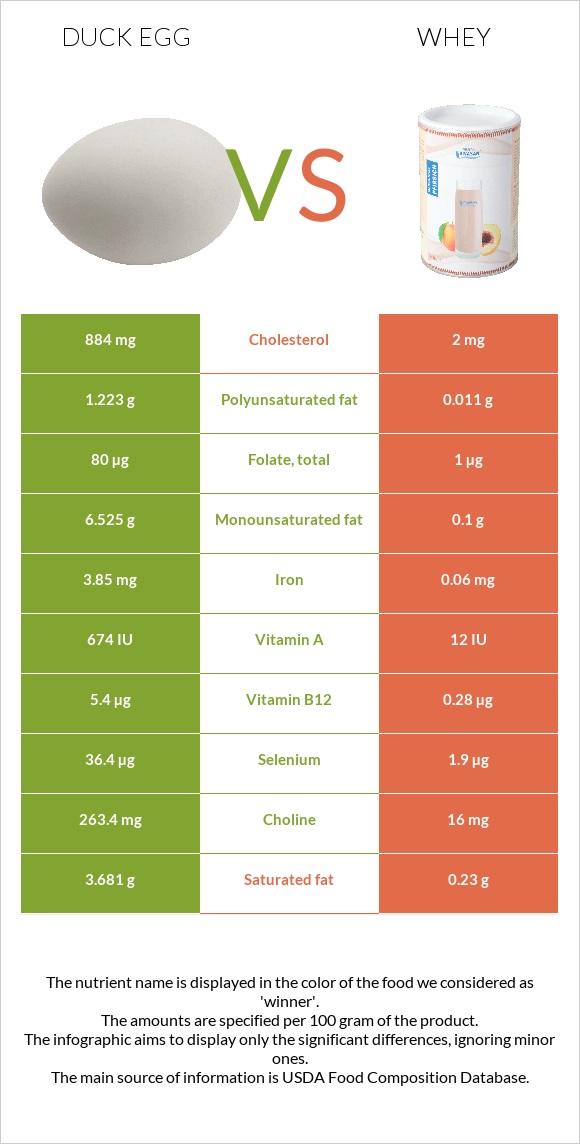
Important differences between duck eggs and whey Whey has less vitamin B12, selenium, iron, choline, vitamin B5, phosphorus, folate, and vitamin B2. Duck eggs' daily need coverage for cholesterol is 294% more. Duck eggs have 80 times more folate than whey. Duck eggs have 80µg of folate, while whey has 1µg. Whey is lower in cholesterol. The food varieties used in the comparison are Egg, duck, whole, fresh, raw and Whey, sweet, fluid .
Infographic
Mineral Comparison
Mineral comparison score is based on the number of minerals by which one or the other food is richer. The "coverage" charts below show how much of the daily needs can be covered by 300 grams of the food.
9
100 g
300 g
1 egg - 70g
Magnesium
Magnesium
Calcium
Calcium
Potassium
Potassium
Iron
Iron
Copper
Copper
Zinc
Zinc
Phosphorus
Phosphorus
Sodium
Sodium
Manganese
Manganese
Selenium
Selenium
12%
19%
20%
144%
21%
38%
94%
19%
5%
199%
1
100 g
300 g
1 cup - 246g 1 quart - 984g
Magnesium
Magnesium
Calcium
Calcium
Potassium
Potassium
Iron
Iron
Copper
Copper
Zinc
Zinc
Phosphorus
Phosphorus
Sodium
Sodium
Manganese
Manganese
Selenium
Selenium
5.7%
14%
14%
2.3%
1.3%
3.5%
20%
7%
0.13%
10%
Vitamin Comparison
Vitamin comparison score is based on the number of vitamins by which one or the other food is richer. The "coverage" charts below show how much of the daily needs can be covered by 300 grams of the food.
11
100 g
300 g
1 egg - 70g
Vitamin C
Vit. C
Vitamin D
Vit. D
Vitamin A
Vit. A
Vitamin E
Vit. E
Vitamin B1
Vit. B1
Vitamin B2
Vit. B2
Vitamin B3
Vit. B3
Vitamin B5
Vit. B5
Vitamin B6
Vit. B6
Vitamin B12
Vit. B12
Vitamin K
Vit. K
Folate
Folate
0%
26%
65%
27%
39%
93%
3.8%
112%
58%
675%
1%
60%
1
100 g
300 g
1 cup - 246g 1 quart - 984g
Vitamin C
Vit. C
Vitamin D
Vit. D
Vitamin A
Vit. A
Vitamin E
Vit. E
Vitamin B1
Vit. B1
Vitamin B2
Vit. B2
Vitamin B3
Vit. B3
Vitamin B5
Vit. B5
Vitamin B6
Vit. B6
Vitamin B12
Vit. B12
Vitamin K
Vit. K
Folate
Folate
0.33%
0%
1%
0%
9%
36%
1.4%
23%
7.2%
35%
0%
0.75%
All nutrients comparison - raw data values
Nutrient
DV% diff.
Cholesterol
884mg
2mg
294%
Vitamin B12
5.4µg
0.28µg
213%
Selenium
36.4µg
1.9µg
63%
Iron
3.85mg
0.06mg
47%
Choline
263.4mg
16mg
45%
Vitamin B5
1.862mg
0.383mg
30%
Phosphorus
220mg
46mg
25%
Protein
12.81g
0.85g
24%
Fats
13.77g
0.36g
21%
Vitamin A
194µg
3µg
21%
Folate
80µg
1µg
20%
Vitamin B2
0.404mg
0.158mg
19%
Vitamin B6
0.25mg
0.031mg
17%
Saturated fat
3.681g
0.23g
16%
Monounsaturated fat
6.525g
0.1g
16%
Zinc
1.41mg
0.13mg
12%
Vitamin B1
0.156mg
0.036mg
10%
Vitamin D*
69 IU
9%
Vitamin D
1.7µg
9%
Vitamin E
1.34mg
0mg
9%
Calories
185kcal
27kcal
8%
Polyunsaturated fat
1.223g
0.011g
8%
Copper
0.062mg
0.004mg
6%
Sodium
146mg
54mg
4%
Magnesium
17mg
8mg
2%
Calcium
64mg
47mg
2%
Potassium
222mg
161mg
2%
Manganese
0.038mg
0.001mg
2%
Carbs
1.45g
5.14g
1%
Vitamin B3
0.2mg
0.074mg
1%
Protein per 100 calories
6.9g
3.1g
N/A
Calories per 10 g protein
144kcal
318kcal
N/A
Weight per 100 calories
54g
370g
N/A
Unsaturated / Saturated Fat ratio
2.1
0.48
N/A
Vitamin C
0mg
0.1mg
0%
Net carbs
1.45g
5.14g
N/A
Sugar
0.93g
5.14g
N/A
Vitamin K
0.4µg
0µg
0%
Tryptophan
0.26mg
0.013mg
0%
Threonine
0.736mg
0.054mg
0%
Isoleucine
0.598mg
0.047mg
0%
Leucine
1.097mg
0.078mg
0%
Lysine
0.951mg
0.068mg
0%
Methionine
0.576mg
0.016mg
0%
Phenylalanine
0.84mg
0.027mg
0%
Valine
0.885mg
0.046mg
0%
Histidine
0.32mg
0.016mg
0%
Macronutrient Comparison
Macronutrient breakdown side-by-side comparison
3
13%
14%
71%
Protein:
12.81 g
Fats:
13.77 g
Carbs:
1.45 g
Water:
70.83 g
Other:
1.14 g
2
5%
93%
Protein:
0.85 g
Fats:
0.36 g
Carbs:
5.14 g
Water:
93.12 g
Other:
0.53 g
Contains
more
Protein Protein
+1407.1%
Contains
more
Fats Fats
+3725%
Contains
more
Other Other
+115.1%
Contains
more
Carbs Carbs
+254.5%
Contains
more
Water Water
+31.5%
Fat Type Comparison
Fat type breakdown side-by-side comparison
2
32%
57%
11%
Saturated fat:
Sat. Fat
3.681 g
Monounsaturated fat:
Mono. Fat
6.525 g
Polyunsaturated fat:
Poly. Fat
1.223 g
1
67%
29%
3%
Saturated fat:
Sat. Fat
0.23 g
Monounsaturated fat:
Mono. Fat
0.1 g
Polyunsaturated fat:
Poly. Fat
0.011 g
Contains
more
Mono. Fat Monounsaturated fat
+6425%
Contains
more
Poly. Fat Polyunsaturated fat
+11018.2%
Contains
less
Sat. Fat Saturated fat
-93.8%