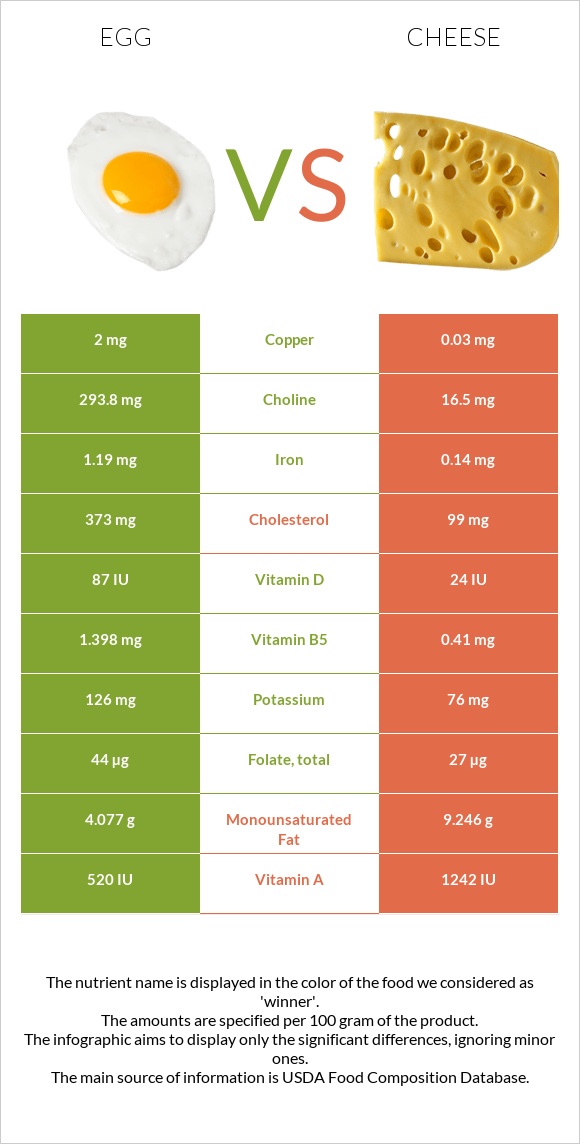
How are eggs and cheese different? Eggs have more copper and choline; however, cheese is richer in calcium, phosphorus, fats, protein, and zinc. Eggs cover your daily need for copper 219% more than cheese. Eggs have 18 times more choline than cheese. Eggs have 293.8mg of choline, while cheese has 16.5mg. Cheese contains less cholesterol. Egg, whole, cooked, hard-boiled and Cheese, cheddar types were used in this article.
Infographic
Mineral Comparison
The mineral comparison score is based on which food has a more favorable amount of each mineral. The �coverage� charts below show how much of the daily mineral needs are covered by the selected amount of each food.
4
100 g
300 g
1 tbsp - 8.5g 1 large - 50g 1 cup, chopped - 136g
Magnesium
Magnesium
Calcium
Calcium
Potassium
Potassium
Iron
Iron
Copper
Copper
Zinc
Zinc
Phosphorus
Phosphorus
Sodium
Sodium
Manganese
Manganese
Selenium
Selenium
7.1%
15%
11%
45%
667%
29%
74%
16%
3.4%
168%
4
100 g
300 g
1 cubic inch - 17g 1 slice (1 oz) - 28g 1 oz - 28.35g 1 cup, shredded - 113g 1 cup, diced - 132g 1 cup, melted - 244g
Magnesium
Magnesium
Calcium
Calcium
Potassium
Potassium
Iron
Iron
Copper
Copper
Zinc
Zinc
Phosphorus
Phosphorus
Sodium
Sodium
Manganese
Manganese
Selenium
Selenium
19%
213%
6.7%
5.3%
10%
99%
195%
85%
3.5%
155%
Vitamin Comparison
The vitamin comparison score is based on the number of vitamins in which one food is richer than the other. The �coverage� charts below show how much of the daily vitamin needs are covered by the selected amount of each food.
7
100 g
300 g
1 tbsp - 8.5g 1 large - 50g 1 cup, chopped - 136g
Vitamin C
Vit. C
Vitamin D
Vit. D
Vitamin A
Vit. A
Vitamin E
Vit. E
Vitamin B1
Vit. B1
Vitamin B2
Vit. B2
Vitamin B3
Vit. B3
Vitamin B5
Vit. B5
Vitamin B6
Vit. B6
Vitamin B12
Vit. B12
Vitamin K
Vit. K
Folate
Folate
0%
33%
50%
21%
17%
118%
1.2%
84%
28%
139%
0.75%
33%
2
100 g
300 g
1 cubic inch - 17g 1 slice (1 oz) - 28g 1 oz - 28.35g 1 cup, shredded - 113g 1 cup, diced - 132g 1 cup, melted - 244g
Vitamin C
Vit. C
Vitamin D
Vit. D
Vitamin A
Vit. A
Vitamin E
Vit. E
Vitamin B1
Vit. B1
Vitamin B2
Vit. B2
Vitamin B3
Vit. B3
Vitamin B5
Vit. B5
Vitamin B6
Vit. B6
Vitamin B12
Vit. B12
Vitamin K
Vit. K
Folate
Folate
0%
9%
110%
14%
7.3%
99%
1.1%
25%
15%
138%
6%
20%
All nutrients comparison - raw data values
Nutrient
DV% diff.
Copper
2mg
0.03mg
219%
Cholesterol
373mg
99mg
91%
Saturated fat
3.267g
18.867g
71%
Calcium
50mg
710mg
66%
Choline
293.8mg
16.5mg
50%
Phosphorus
172mg
455mg
40%
Fats
10.61g
33.31g
35%
Zinc
1.05mg
3.64mg
24%
Sodium
124mg
653mg
23%
Protein
12.58g
22.87g
21%
Vitamin A
149µg
330µg
20%
Vitamin B5
1.398mg
0.41mg
20%
Iron
1.19mg
0.14mg
13%
Monounsaturated fat
4.077g
9.246g
13%
Calories
155kcal
404kcal
12%
Vitamin D*
87 IU
24 IU
8%
Vitamin D
2.2µg
0.6µg
8%
Vitamin B2
0.513mg
0.428mg
7%
Magnesium
10mg
27mg
4%
Selenium
30.8µg
28.5µg
4%
Vitamin B6
0.121mg
0.066mg
4%
Folate
44µg
27µg
4%
Vitamin B1
0.066mg
0.029mg
3%
Vitamin E
1.03mg
0.71mg
2%
Vitamin K
0.3µg
2.4µg
2%
Carbs
1.12g
3.09g
1%
Potassium
126mg
76mg
1%
Protein per 100 calories
8.1g
5.7g
N/A
Calories per 10 g protein
123kcal
177kcal
N/A
Weight per 100 calories
65g
25g
N/A
Unsaturated / Saturated Fat ratio
1.7
0.57
N/A
Net carbs
1.12g
3.09g
N/A
Sugar
1.12g
0.48g
N/A
Manganese
0.026mg
0.027mg
0%
Vitamin B3
0.064mg
0.059mg
0%
Vitamin B12
1.11µg
1.1µg
0%
Trans fat
0.917g
N/A
Polyunsaturated fat
1.414g
1.421g
0%
Tryptophan
0.153mg
0.547mg
0%
Threonine
0.604mg
1.044mg
0%
Isoleucine
0.686mg
1.206mg
0%
Leucine
1.075mg
1.939mg
0%
Lysine
0.904mg
1.025mg
0%
Methionine
0.392mg
0.547mg
0%
Phenylalanine
0.668mg
1.074mg
0%
Valine
0.767mg
1.404mg
0%
Histidine
0.298mg
0.547mg
0%
Omega-3 (EPA)
0.005g
0.01g
N/A
Omega-3 (DHA)
0.038g
0.001g
N/A
Omega-3 (DPA)
0g
0.017g
N/A
Omega-6 (Eicosadienoic acid)
0.007g
N/A
Macronutrient Comparison
Macronutrient breakdown side-by-side comparison
1
13%
11%
75%
Protein:
12.58 g
Fats:
10.61 g
Carbs:
1.12 g
Water:
74.62 g
Other:
1.07 g
3
23%
33%
3%
37%
4%
Protein:
22.87 g
Fats:
33.31 g
Carbs:
3.09 g
Water:
37.02 g
Other:
3.71 g
Contains
more
Water Water
+101.6%
Contains
more
Protein Protein
+81.8%
Contains
more
Fats Fats
+213.9%
Contains
more
Carbs Carbs
+175.9%
Fat Type Comparison
Fat type breakdown side-by-side comparison
1
37%
47%
16%
Saturated fat:
Sat. Fat
3.267 g
Monounsaturated fat:
Mono. Fat
4.077 g
Polyunsaturated fat:
Poly. Fat
1.414 g
2
64%
31%
5%
Saturated fat:
Sat. Fat
18.867 g
Monounsaturated fat:
Mono. Fat
9.246 g
Polyunsaturated fat:
Poly. Fat
1.421 g
Contains
less
Sat. Fat Saturated fat
-82.7%
Contains
more
Mono. Fat Monounsaturated fat
+126.8%
~equal in
Polyunsaturated fat
~1.421g