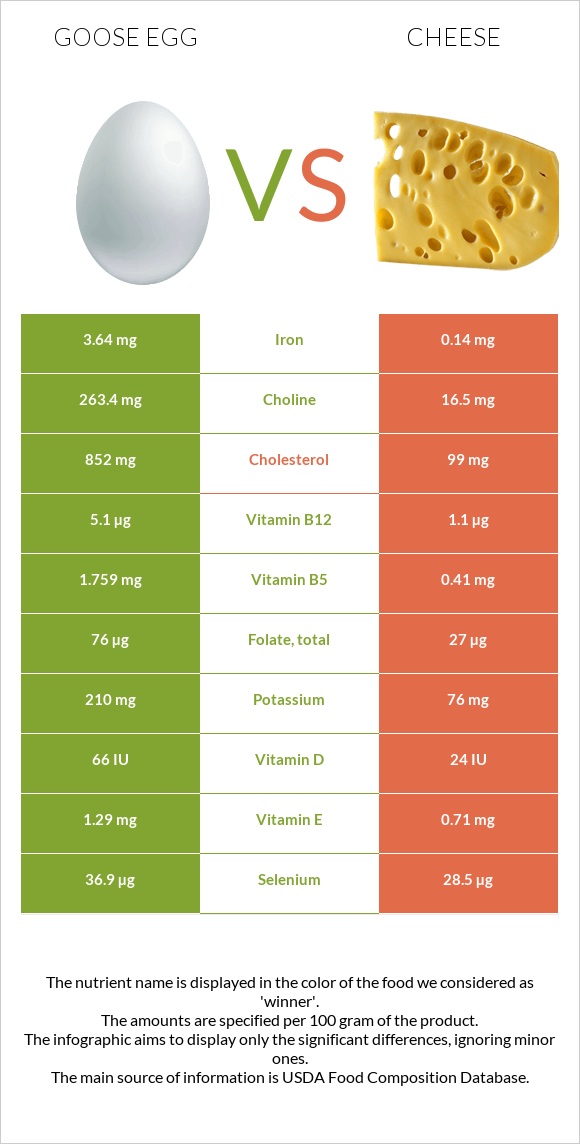
How are goose eggs and cheese different? Goose eggs have more vitamin B12, choline, iron, and vitamin B5; however, cheese is richer in calcium, phosphorus, and zinc. Goose eggs cover your daily need for cholesterol, 251% more than cheese. Goose eggs have 26 times more iron than cheese. Goose eggs have 3.64mg of iron, while cheese has 0.14mg. Cheese contains less cholesterol. Egg, goose, whole, fresh, raw and Cheese, cheddar types were used in this article.
Infographic
Mineral Comparison
Mineral comparison score is based on the number of minerals by which one or the other food is richer. The "coverage" charts below show how much of the daily needs can be covered by 300 grams of the food.
6
100 g
300 g
1 egg - 144g
Magnesium
Magnesium
Calcium
Calcium
Potassium
Potassium
Iron
Iron
Copper
Copper
Zinc
Zinc
Phosphorus
Phosphorus
Sodium
Sodium
Manganese
Manganese
Selenium
Selenium
11%
18%
19%
137%
21%
36%
89%
18%
5%
201%
4
100 g
300 g
1 cubic inch - 17g 1 slice (1 oz) - 28g 1 oz - 28.35g 1 cup, shredded - 113g 1 cup, diced - 132g 1 cup, melted - 244g
Magnesium
Magnesium
Calcium
Calcium
Potassium
Potassium
Iron
Iron
Copper
Copper
Zinc
Zinc
Phosphorus
Phosphorus
Sodium
Sodium
Manganese
Manganese
Selenium
Selenium
19%
213%
6.7%
5.3%
10%
99%
195%
85%
3.5%
155%
Vitamin Comparison
Vitamin comparison score is based on the number of vitamins by which one or the other food is richer. The "coverage" charts below show how much of the daily needs can be covered by 300 grams of the food.
8
100 g
300 g
1 egg - 144g
Vitamin C
Vit. C
Vitamin D
Vit. D
Vitamin A
Vit. A
Vitamin E
Vit. E
Vitamin B1
Vit. B1
Vitamin B2
Vit. B2
Vitamin B3
Vit. B3
Vitamin B5
Vit. B5
Vitamin B6
Vit. B6
Vitamin B12
Vit. B12
Vitamin K
Vit. K
Folate
Folate
0%
26%
62%
26%
37%
88%
3.5%
106%
54%
638%
1%
57%
3
100 g
300 g
1 cubic inch - 17g 1 slice (1 oz) - 28g 1 oz - 28.35g 1 cup, shredded - 113g 1 cup, diced - 132g 1 cup, melted - 244g
Vitamin C
Vit. C
Vitamin D
Vit. D
Vitamin A
Vit. A
Vitamin E
Vit. E
Vitamin B1
Vit. B1
Vitamin B2
Vit. B2
Vitamin B3
Vit. B3
Vitamin B5
Vit. B5
Vitamin B6
Vit. B6
Vitamin B12
Vit. B12
Vitamin K
Vit. K
Folate
Folate
0%
9%
110%
14%
7.3%
99%
1.1%
25%
15%
138%
6%
20%
All nutrients comparison - raw data values
Nutrient
DV% diff.
Cholesterol
852mg
99mg
251%
Vitamin B12
5.1µg
1.1µg
167%
Saturated fat
3.595g
18.867g
69%
Calcium
60mg
710mg
65%
Choline
263.4mg
16.5mg
45%
Iron
3.64mg
0.14mg
44%
Phosphorus
208mg
455mg
35%
Fats
13.27g
33.31g
31%
Vitamin B5
1.759mg
0.41mg
27%
Sodium
138mg
653mg
22%
Zinc
1.33mg
3.64mg
21%
Protein
13.87g
22.87g
18%
Vitamin A
187µg
330µg
16%
Selenium
36.9µg
28.5µg
15%
Vitamin B6
0.236mg
0.066mg
13%
Folate
76µg
27µg
12%
Calories
185kcal
404kcal
11%
Vitamin B1
0.147mg
0.029mg
10%
Monounsaturated fat
5.747g
9.246g
9%
Vitamin D
1.7µg
0.6µg
6%
Vitamin D*
66 IU
24 IU
5%
Potassium
210mg
76mg
4%
Copper
0.062mg
0.03mg
4%
Vitamin E
1.29mg
0.71mg
4%
Vitamin B2
0.382mg
0.428mg
4%
Magnesium
16mg
27mg
3%
Vitamin K
0.4µg
2.4µg
2%
Polyunsaturated fat
1.672g
1.421g
2%
Carbs
1.35g
3.09g
1%
Vitamin B3
0.189mg
0.059mg
1%
Protein per 100 calories
7.5g
5.7g
N/A
Calories per 10 g protein
133kcal
177kcal
N/A
Weight per 100 calories
54g
25g
N/A
Unsaturated / Saturated Fat ratio
2.1
0.57
N/A
Net carbs
1.35g
3.09g
N/A
Sugar
0.94g
0.48g
N/A
Manganese
0.038mg
0.027mg
0%
Trans fat
0.917g
N/A
Tryptophan
0.282mg
0.547mg
0%
Threonine
0.797mg
1.044mg
0%
Isoleucine
0.647mg
1.206mg
0%
Leucine
1.188mg
1.939mg
0%
Lysine
1.03mg
1.025mg
0%
Methionine
0.624mg
0.547mg
0%
Phenylalanine
0.91mg
1.074mg
0%
Valine
0.958mg
1.404mg
0%
Histidine
0.346mg
0.547mg
0%
Omega-3 - EPA
0g
0.01g
N/A
Omega-3 - DHA
0g
0.001g
N/A
Omega-3 - DPA
0g
0.017g
N/A
Omega-6 - Eicosadienoic acid
0.007g
N/A
Macronutrient Comparison
Macronutrient breakdown side-by-side comparison
1
14%
13%
70%
Protein:
13.87 g
Fats:
13.27 g
Carbs:
1.35 g
Water:
70.43 g
Other:
1.08 g
4
23%
33%
3%
37%
4%
Protein:
22.87 g
Fats:
33.31 g
Carbs:
3.09 g
Water:
37.02 g
Other:
3.71 g
Contains
more
Water Water
+90.2%
Contains
more
Protein Protein
+64.9%
Contains
more
Fats Fats
+151%
Contains
more
Carbs Carbs
+128.9%
Contains
more
Other Other
+243.5%
Fat Type Comparison
Fat type breakdown side-by-side comparison
2
33%
52%
15%
Saturated fat:
Sat. Fat
3.595 g
Monounsaturated fat:
Mono. Fat
5.747 g
Polyunsaturated fat:
Poly. Fat
1.672 g
1
64%
31%
5%
Saturated fat:
Sat. Fat
18.867 g
Monounsaturated fat:
Mono. Fat
9.246 g
Polyunsaturated fat:
Poly. Fat
1.421 g
Contains
less
Sat. Fat Saturated fat
-80.9%
Contains
more
Poly. Fat Polyunsaturated fat
+17.7%
Contains
more
Mono. Fat Monounsaturated fat
+60.9%