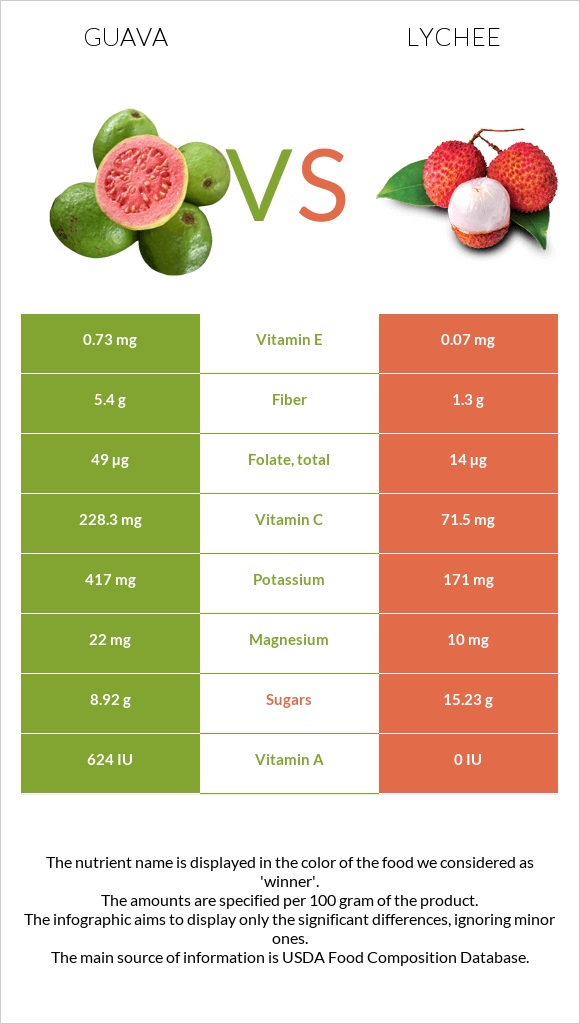
Summary of differences between guava and lychee Lychee has less vitamin C, fiber, vitamin A, copper, folate, and potassium than guava. Guava covers your daily need for vitamin C, 174% more than lychee. Guava has less sugar. The glycemic index of lychee is higher. These are the specific foods used in this comparison Guavas, common, raw and Litchis, raw .
Infographic
Mineral Comparison
Mineral comparison score is based on the number of minerals by which one or the other food is richer. The "coverage" charts below show how much of the daily needs can be covered by 300 grams of the food.
7
100 g
300 g
1 fruit, without refuse - 55g 1 cup - 165g
Magnesium
Magnesium
Calcium
Calcium
Potassium
Potassium
Iron
Iron
Copper
Copper
Zinc
Zinc
Phosphorus
Phosphorus
Sodium
Sodium
Manganese
Manganese
Selenium
Selenium
16%
5.4%
37%
9.8%
77%
6.3%
17%
0.26%
20%
3.3%
2
100 g
300 g
1 fruit without refuse - 9.6g 1 cup - 190g
Magnesium
Magnesium
Calcium
Calcium
Potassium
Potassium
Iron
Iron
Copper
Copper
Zinc
Zinc
Phosphorus
Phosphorus
Sodium
Sodium
Manganese
Manganese
Selenium
Selenium
7.1%
1.5%
15%
12%
49%
1.9%
13%
0.13%
7.2%
3.3%
Vitamin Comparison
Vitamin comparison score is based on the number of vitamins by which one or the other food is richer. The "coverage" charts below show how much of the daily needs can be covered by 300 grams of the food.
8
100 g
300 g
1 fruit, without refuse - 55g 1 cup - 165g
Vitamin C
Vit. C
Vitamin D
Vit. D
Vitamin A
Vit. A
Vitamin E
Vit. E
Vitamin B1
Vit. B1
Vitamin B2
Vit. B2
Vitamin B3
Vit. B3
Vitamin B5
Vit. B5
Vitamin B6
Vit. B6
Vitamin B12
Vit. B12
Vitamin K
Vit. K
Folate
Folate
761%
0%
10%
15%
17%
9.2%
20%
27%
25%
0%
6.5%
37%
1
100 g
300 g
1 fruit without refuse - 9.6g 1 cup - 190g
Vitamin C
Vit. C
Vitamin D
Vit. D
Vitamin A
Vit. A
Vitamin E
Vit. E
Vitamin B1
Vit. B1
Vitamin B2
Vit. B2
Vitamin B3
Vit. B3
Vitamin B5
Vit. B5
Vitamin B6
Vit. B6
Vitamin B12
Vit. B12
Vitamin K
Vit. K
Folate
Folate
238%
0%
0%
1.4%
2.8%
15%
11%
0%
23%
0%
1%
11%
All nutrients comparison - raw data values
Nutrient
DV% diff.
Vitamin C
228.3mg
71.5mg
174%
Fiber
5.4g
1.3g
16%
Copper
0.23mg
0.148mg
9%
Vitamin B5
0.451mg
9%
Folate
49µg
14µg
9%
Potassium
417mg
171mg
7%
Vitamin B1
0.067mg
0.011mg
5%
Vitamin E
0.73mg
0.07mg
4%
Manganese
0.15mg
0.055mg
4%
Protein
2.55g
0.83g
3%
Magnesium
22mg
10mg
3%
Vitamin A
31µg
0µg
3%
Vitamin B3
1.084mg
0.603mg
3%
Vitamin B2
0.04mg
0.065mg
2%
Vitamin K
2.6µg
0.4µg
2%
Polyunsaturated fat
0.401g
0.132g
2%
Fats
0.95g
0.44g
1%
Carbs
14.32g
16.53g
1%
Calcium
18mg
5mg
1%
Iron
0.26mg
0.31mg
1%
Zinc
0.23mg
0.07mg
1%
Phosphorus
40mg
31mg
1%
Vitamin B6
0.11mg
0.1mg
1%
Saturated fat
0.272g
0.099g
1%
Calories
68kcal
66kcal
0%
Protein per 100 calories
3.8g
1.3g
N/A
Calories per 10 g protein
267kcal
795kcal
N/A
Weight per 100 calories
147g
152g
N/A
Net carbs
8.92g
15.23g
N/A
Sugar
8.92g
15.23g
N/A
Sodium
2mg
1mg
0%
Selenium
0.6µg
0.6µg
0%
Choline
7.6mg
7.1mg
0%
Monounsaturated fat
0.087g
0.12g
0%
Tryptophan
0.022mg
0.007mg
0%
Threonine
0.096mg
0%
Isoleucine
0.093mg
0%
Leucine
0.171mg
0%
Lysine
0.072mg
0.041mg
0%
Methionine
0.016mg
0.009mg
0%
Phenylalanine
0.006mg
0%
Valine
0.087mg
0%
Histidine
0.022mg
0%
Macronutrient Comparison
Macronutrient breakdown side-by-side comparison
3
3%
14%
81%
Protein:
2.55 g
Fats:
0.95 g
Carbs:
14.32 g
Water:
80.8 g
Other:
1.38 g
2
17%
82%
Protein:
0.83 g
Fats:
0.44 g
Carbs:
16.53 g
Water:
81.76 g
Other:
0.44 g
Contains
more
Protein Protein
+207.2%
Contains
more
Fats Fats
+115.9%
Contains
more
Other Other
+213.6%
Contains
more
Carbs Carbs
+15.4%
Fat Type Comparison
Fat type breakdown side-by-side comparison
1
36%
11%
53%
Saturated fat:
Sat. Fat
0.272 g
Monounsaturated fat:
Mono. Fat
0.087 g
Polyunsaturated fat:
Poly. Fat
0.401 g
2
28%
34%
38%
Saturated fat:
Sat. Fat
0.099 g
Monounsaturated fat:
Mono. Fat
0.12 g
Polyunsaturated fat:
Poly. Fat
0.132 g
Contains
more
Poly. Fat Polyunsaturated fat
+203.8%
Contains
less
Sat. Fat Saturated fat
-63.6%
Contains
more
Mono. Fat Monounsaturated fat
+37.9%