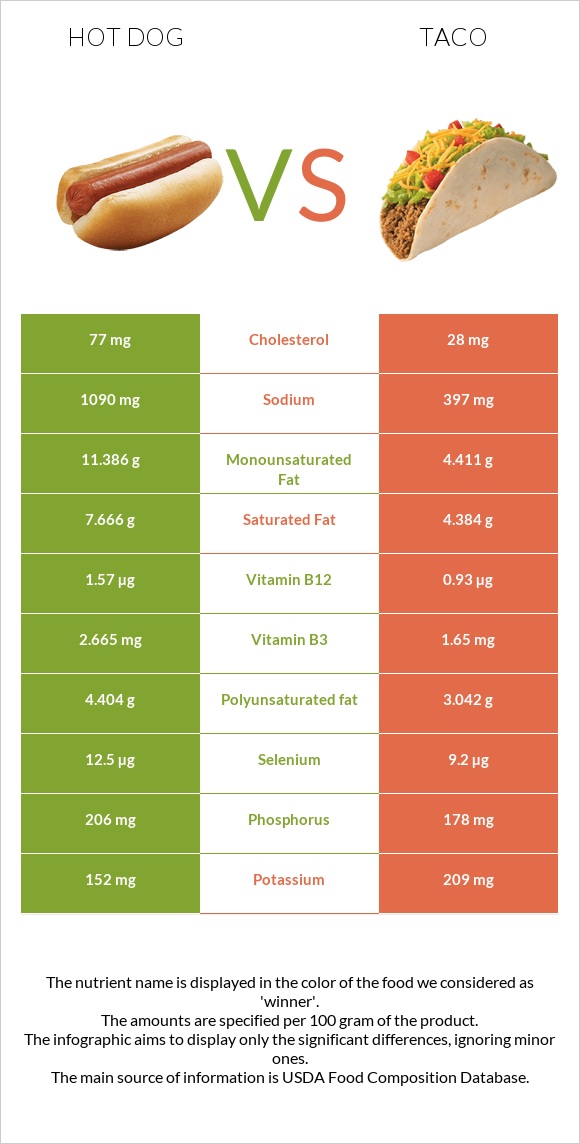
Important differences between hot dogs and taco Hot dogs have more vitamin B12, vitamin B3, selenium, and vitamin B6; however, taco is richer in fiber and manganese. Hot dogs' daily need coverage for sodium is 30% more. Hot dogs contain 3 times more cholesterol than taco. Hot dogs contain 77mg of cholesterol, while taco contains 28mg. Taco has a higher glycemic index. The glycemic index of taco is 39, while the glycemic index of hot dogs is 28. The food varieties used in the comparison are Frankfurter, meat and Fast foods, taco with beef, cheese, and lettuce, hard shell .
Infographic
Mineral Comparison
Mineral comparison score is based on the number of minerals by which one or the other food is richer. The "coverage" charts below show how much of the daily needs can be covered by 300 grams of the food.
4
100 g
300 g
1 serving (1 hot dog) - 52g
Magnesium
Magnesium
Calcium
Calcium
Potassium
Potassium
Iron
Iron
Copper
Copper
Zinc
Zinc
Phosphorus
Phosphorus
Sodium
Sodium
Manganese
Manganese
Selenium
Selenium
11%
30%
13%
41%
32%
33%
88%
142%
5.9%
68%
5
100 g
300 g
1 each taco - 69g
Magnesium
Magnesium
Calcium
Calcium
Potassium
Potassium
Iron
Iron
Copper
Copper
Zinc
Zinc
Phosphorus
Phosphorus
Sodium
Sodium
Manganese
Manganese
Selenium
Selenium
23%
27%
18%
45%
26%
48%
76%
52%
32%
50%
Vitamin Comparison
Vitamin comparison score is based on the number of vitamins by which one or the other food is richer. The "coverage" charts below show how much of the daily needs can be covered by 300 grams of the food.
5
100 g
300 g
1 serving (1 hot dog) - 52g
Vitamin C
Vit. C
Vitamin D
Vit. D
Vitamin A
Vit. A
Vitamin E
Vit. E
Vitamin B1
Vit. B1
Vitamin B2
Vit. B2
Vitamin B3
Vit. B3
Vitamin B5
Vit. B5
Vitamin B6
Vit. B6
Vitamin B12
Vit. B12
Vitamin K
Vit. K
Folate
Folate
0%
0%
0%
3.8%
14%
28%
50%
19%
38%
196%
0%
4.5%
6
100 g
300 g
1 each taco - 69g
Vitamin C
Vit. C
Vitamin D
Vit. D
Vitamin A
Vit. A
Vitamin E
Vit. E
Vitamin B1
Vit. B1
Vitamin B2
Vit. B2
Vitamin B3
Vit. B3
Vitamin B5
Vit. B5
Vitamin B6
Vit. B6
Vitamin B12
Vit. B12
Vitamin K
Vit. K
Folate
Folate
1.3%
1.5%
6.7%
12%
13%
14%
31%
0%
21%
116%
38%
14%
All nutrients comparison - raw data values
Nutrient
DV% diff.
Sodium
1090mg
397mg
30%
Vitamin B12
1.57µg
0.93µg
27%
Fats
25.76g
12.7g
20%
Monounsaturated fat
11.386g
4.411g
17%
Cholesterol
77mg
28mg
16%
Fiber
0g
3.9g
16%
Saturated fat
7.666g
4.384g
15%
Vitamin K
15.3µg
13%
Manganese
0.045mg
0.249mg
9%
Polyunsaturated fat
4.404g
3.042g
9%
Starch
14.78g
6%
Selenium
12.5µg
9.2µg
6%
Vitamin B3
2.665mg
1.65mg
6%
Vitamin B5
0.31mg
6%
Vitamin B6
0.166mg
0.09mg
6%
Choline
32mg
6%
Carbs
4.17g
19.85g
5%
Zinc
1.2mg
1.75mg
5%
Vitamin B2
0.121mg
0.06mg
5%
Magnesium
15mg
32mg
4%
Phosphorus
206mg
178mg
4%
Calories
290kcal
226kcal
3%
Protein
10.26g
8.86g
3%
Vitamin E
0.19mg
0.6mg
3%
Folate
6µg
19µg
3%
Potassium
152mg
209mg
2%
Copper
0.097mg
0.077mg
2%
Vitamin A
0µg
20µg
2%
Vitamin D*
4 IU
1%
Vitamin D
0.1µg
1%
Calcium
99mg
89mg
1%
Iron
1.09mg
1.19mg
1%
Protein per 100 calories
3.5g
3.9g
N/A
Calories per 10 g protein
283kcal
255kcal
N/A
Weight per 100 calories
34g
44g
N/A
Unsaturated / Saturated Fat ratio
2.1
1.7
N/A
Vitamin C
0mg
0.4mg
0%
Net carbs
4.17g
15.95g
N/A
Sugar
0.9g
N/A
Vitamin B1
0.055mg
0.05mg
0%
Trans fat
0.467g
N/A
Tryptophan
0.111mg
0%
Threonine
0.474mg
0%
Isoleucine
0.53mg
0%
Leucine
0.907mg
0%
Lysine
0.963mg
0%
Methionine
0.291mg
0%
Phenylalanine
0.445mg
0%
Valine
0.555mg
0%
Histidine
0.331mg
0%
Fructose
0.3g
0%
Omega-3 - EPA
0g
0.005g
N/A
Omega-3 - ALA
0.166g
N/A
Omega-3 - DPA
0g
0.006g
N/A
Omega-3 - Eicosatrienoic acid
0.001g
N/A
Omega-6 - Gamma-linoleic acid
0.002g
N/A
Omega-6 - Dihomo-gamma-linoleic acid
0.011g
N/A
Omega-6 - Eicosadienoic acid
0.004g
N/A
Omega-6 - Linoleic acid
2.708g
N/A
Macronutrient Comparison
Macronutrient breakdown side-by-side comparison
3
10%
26%
4%
56%
4%
Protein:
10.26 g
Fats:
25.76 g
Carbs:
4.17 g
Water:
56.31 g
Other:
3.5 g
2
9%
13%
20%
57%
Protein:
8.86 g
Fats:
12.7 g
Carbs:
19.85 g
Water:
57.02 g
Other:
1.57 g
Contains
more
Protein Protein
+15.8%
Contains
more
Fats Fats
+102.8%
Contains
more
Other Other
+122.9%
Contains
more
Carbs Carbs
+376%
Fat Type Comparison
Fat type breakdown side-by-side comparison
2
33%
49%
19%
Saturated fat:
Sat. Fat
7.666 g
Monounsaturated fat:
Mono. Fat
11.386 g
Polyunsaturated fat:
Poly. Fat
4.404 g
1
37%
37%
26%
Saturated fat:
Sat. Fat
4.384 g
Monounsaturated fat:
Mono. Fat
4.411 g
Polyunsaturated fat:
Poly. Fat
3.042 g
Contains
more
Mono. Fat Monounsaturated fat
+158.1%
Contains
more
Poly. Fat Polyunsaturated fat
+44.8%
Contains
less
Sat. Fat Saturated fat
-42.8%