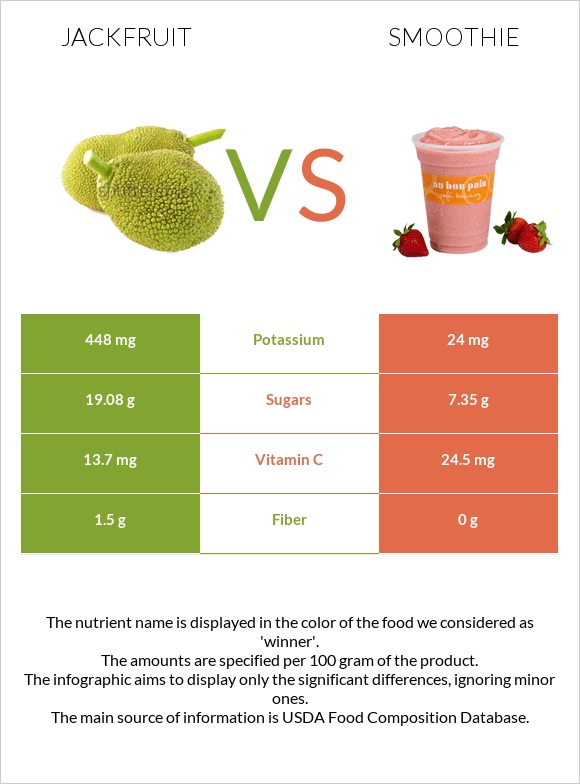
Differences between jackfruit and smoothie Jackfruit has more vitamin B6, potassium, and fiber, while smoothie has more vitamin C, vitamin B12, and vitamin A. Jackfruit's daily need coverage for vitamin B6 is 19% higher. The amount of sugar in smoothie is lower. Smoothie has a lower glycemic index. The glycemic index of smoothie is 44, while the glycemic index of jackfruit is 75. The food types used in this comparison are Jackfruit, raw and Beverages, V8 SPLASH Smoothies, Strawberry Banana .
Infographic
Mineral Comparison
Mineral comparison score is based on the number of minerals by which one or the other food is richer. The "coverage" charts below show how much of the daily needs can be covered by 300 grams of the food.
8
100 g
300 g
1 cup 1" pieces - 151g 1 cup, sliced - 165g
Magnesium
Magnesium
Calcium
Calcium
Potassium
Potassium
Iron
Iron
Copper
Copper
Zinc
Zinc
Phosphorus
Phosphorus
Sodium
Sodium
Manganese
Manganese
Selenium
Selenium
21%
7.2%
40%
8.6%
25%
3.5%
9%
0.26%
5.6%
0%
1
100 g
300 g
1 serving 8 oz - 245g
Magnesium
Magnesium
Calcium
Calcium
Potassium
Potassium
Iron
Iron
Copper
Copper
Zinc
Zinc
Phosphorus
Phosphorus
Sodium
Sodium
Manganese
Manganese
Selenium
Selenium
0%
12%
2.1%
5.6%
0%
0%
0%
3.8%
0%
0%
Vitamin Comparison
Vitamin comparison score is based on the number of vitamins by which one or the other food is richer. The "coverage" charts below show how much of the daily needs can be covered by 300 grams of the food.
8
100 g
300 g
1 cup 1" pieces - 151g 1 cup, sliced - 165g
Vitamin C
Vit. C
Vitamin D
Vit. D
Vitamin A
Vit. A
Vitamin E
Vit. E
Vitamin B1
Vit. B1
Vitamin B2
Vit. B2
Vitamin B3
Vit. B3
Vitamin B5
Vit. B5
Vitamin B6
Vit. B6
Vitamin B12
Vit. B12
Vitamin K
Vit. K
Folate
Folate
46%
0%
1.7%
6.8%
26%
13%
17%
14%
76%
0%
0%
18%
2
100 g
300 g
1 serving 8 oz - 245g
Vitamin C
Vit. C
Vitamin D
Vit. D
Vitamin A
Vit. A
Vitamin E
Vit. E
Vitamin B1
Vit. B1
Vitamin B2
Vit. B2
Vitamin B3
Vit. B3
Vitamin B5
Vit. B5
Vitamin B6
Vit. B6
Vitamin B12
Vit. B12
Vitamin K
Vit. K
Folate
Folate
82%
0%
0%
0%
0%
0%
15%
0%
19%
30%
0%
0%
All nutrients comparison - raw data values
Nutrient
DV% diff.
Vitamin B6
0.329mg
0.082mg
19%
Vitamin C
13.7mg
24.5mg
12%
Potassium
448mg
24mg
12%
Fructose
9.19g
11%
Vitamin B12
0µg
0.24µg
10%
Vitamin B1
0.105mg
9%
Copper
0.076mg
8%
Magnesium
29mg
7%
Fiber
1.5g
0g
6%
Folate
24µg
6%
Carbs
23.25g
8.16g
5%
Vitamin B5
0.235mg
5%
Vitamin B2
0.055mg
4%
Calories
95kcal
37kcal
3%
Phosphorus
21mg
3%
Calcium
24mg
41mg
2%
Vitamin E
0.34mg
2%
Manganese
0.043mg
2%
Protein
1.72g
1.22g
1%
Fats
0.64g
0g
1%
Iron
0.23mg
0.15mg
1%
Zinc
0.13mg
1%
Starch
1.47g
1%
Sodium
2mg
29mg
1%
Vitamin A
5µg
1%
Vitamin B3
0.92mg
0.816mg
1%
Saturated fat
0.195g
0g
1%
Polyunsaturated fat
0.094g
1%
Protein per 100 calories
1.8g
3.3g
N/A
Calories per 10 g protein
552kcal
303kcal
N/A
Weight per 100 calories
105g
270g
N/A
Net carbs
21.75g
8.16g
N/A
Sugar
19.08g
7.35g
N/A
Monounsaturated fat
0.155g
0%
Tryptophan
0.034mg
0%
Threonine
0.086mg
0%
Isoleucine
0.069mg
0%
Leucine
0.103mg
0%
Lysine
0.069mg
0%
Methionine
0.034mg
0%
Phenylalanine
0.052mg
0%
Valine
0.086mg
0%
Histidine
0.034mg
0%
Omega-3 - ALA
0.079g
N/A
Omega-6 - Linoleic acid
0.015g
N/A
Macronutrient Comparison
Macronutrient breakdown side-by-side comparison
4
2%
23%
73%
Protein:
1.72 g
Fats:
0.64 g
Carbs:
23.25 g
Water:
73.46 g
Other:
0.93 g
1
8%
90%
Protein:
1.22 g
Fats:
0 g
Carbs:
8.16 g
Water:
90.28 g
Other:
0.34 g
Contains
more
Protein Protein
+41%
Contains
more
Fats Fats
+∞%
Contains
more
Carbs Carbs
+184.9%
Contains
more
Other Other
+173.5%
Contains
more
Water Water
+22.9%