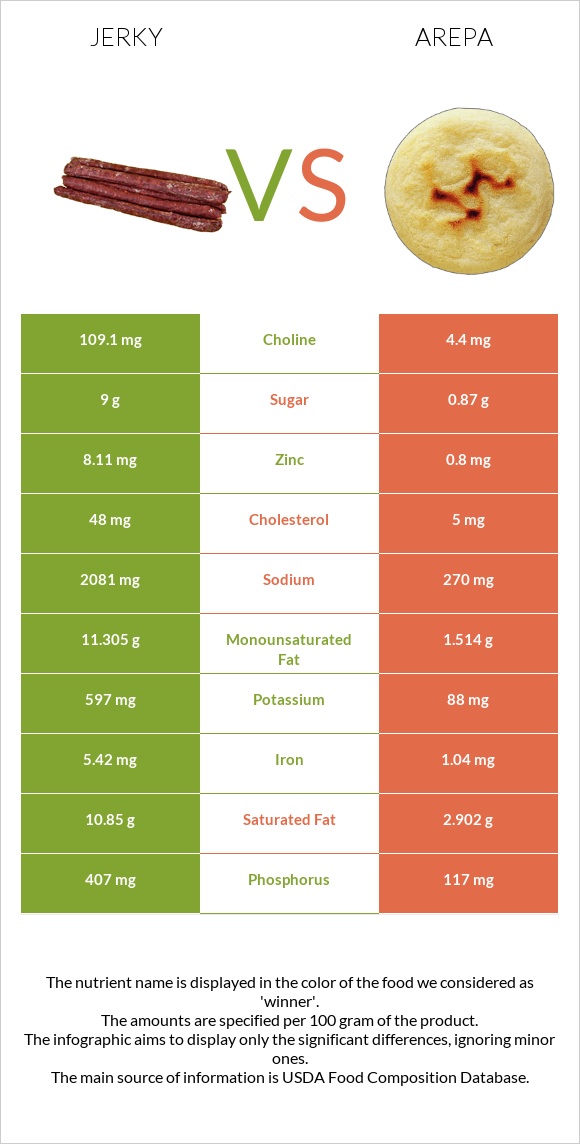
What are the differences between jerky and arepa? Jerky is richer than arepa in zinc, iron, phosphorus, vitamin B12, copper, choline, and potassium. Jerky's daily need coverage for sodium is 79% more. The amount of cholesterol in arepa is lower. The glycemic index of jerky is lower. We used Snacks, beef jerky, chopped, and formed and Restaurant, Latino, arepa (unleavened cornmeal bread) types in this article.
Infographic
Mineral Comparison
Mineral comparison score is based on the number of minerals by which one or the other food is richer. The "coverage" charts below show how much of the daily needs can be covered by 300 grams of the food.
7
100 g
300 g
1 piece, large - 20g 1 oz - 28.35g 1 oz - 28.35g
Magnesium
Magnesium
Calcium
Calcium
Potassium
Potassium
Iron
Iron
Copper
Copper
Zinc
Zinc
Phosphorus
Phosphorus
Sodium
Sodium
Manganese
Manganese
Selenium
Selenium
36%
6%
53%
203%
76%
221%
174%
271%
14%
58%
2
100 g
300 g
1 piece - 98g
Magnesium
Magnesium
Calcium
Calcium
Potassium
Potassium
Iron
Iron
Copper
Copper
Zinc
Zinc
Phosphorus
Phosphorus
Sodium
Sodium
Manganese
Manganese
Selenium
Selenium
19%
27%
7.8%
39%
10%
22%
50%
35%
15%
33%
Vitamin Comparison
Vitamin comparison score is based on the number of vitamins by which one or the other food is richer. The "coverage" charts below show how much of the daily needs can be covered by 300 grams of the food.
8
100 g
300 g
1 piece, large - 20g 1 oz - 28.35g 1 oz - 28.35g
Vitamin C
Vit. C
Vitamin D
Vit. D
Vitamin A
Vit. A
Vitamin E
Vit. E
Vitamin B1
Vit. B1
Vitamin B2
Vit. B2
Vitamin B3
Vit. B3
Vitamin B5
Vit. B5
Vitamin B6
Vit. B6
Vitamin B12
Vit. B12
Vitamin K
Vit. K
Folate
Folate
0%
4.5%
0%
9.8%
39%
33%
32%
9.8%
41%
124%
5.8%
101%
3
100 g
300 g
1 piece - 98g
Vitamin C
Vit. C
Vitamin D
Vit. D
Vitamin A
Vit. A
Vitamin E
Vit. E
Vitamin B1
Vit. B1
Vitamin B2
Vit. B2
Vitamin B3
Vit. B3
Vitamin B5
Vit. B5
Vitamin B6
Vit. B6
Vitamin B12
Vit. B12
Vitamin K
Vit. K
Folate
Folate
0%
0%
20%
5.8%
18%
9.7%
17%
12%
25%
0%
8.8%
0%
All nutrients comparison - raw data values
Nutrient
DV% diff.
Sodium
2081mg
270mg
79%
Zinc
8.11mg
0.8mg
66%
Protein
33.2g
5.48g
55%
Iron
5.42mg
1.04mg
55%
Phosphorus
407mg
117mg
41%
Vitamin B12
0.99µg
0µg
41%
Saturated fat
10.85g
2.902g
36%
Folate
134µg
34%
Fats
25.6g
5.38g
31%
Monounsaturated fat
11.305g
1.514g
24%
Copper
0.227mg
0.03mg
22%
Choline
109.1mg
4.4mg
19%
Potassium
597mg
88mg
15%
Cholesterol
48mg
5mg
14%
Calories
410kcal
219kcal
10%
Carbs
11g
37.14g
9%
Selenium
10.7µg
6.1µg
8%
Vitamin B2
0.142mg
0.042mg
8%
Calcium
20mg
89mg
7%
Vitamin A
0µg
61µg
7%
Vitamin B1
0.154mg
0.07mg
7%
Magnesium
51mg
27mg
6%
Vitamin B6
0.179mg
0.107mg
6%
Vitamin B3
1.732mg
0.888mg
5%
Fiber
1.8g
2.6g
3%
Vitamin D
0.3µg
2%
Vitamin D*
11 IU
1%
Vitamin E
0.49mg
0.29mg
1%
Vitamin B5
0.163mg
0.202mg
1%
Vitamin K
2.3µg
3.5µg
1%
Protein per 100 calories
8.1g
2.5g
N/A
Calories per 10 g protein
123kcal
400kcal
N/A
Weight per 100 calories
24g
46g
N/A
Unsaturated / Saturated Fat ratio
1.1
0.86
N/A
Net carbs
9.2g
34.54g
N/A
Sugar
9g
0.87g
N/A
Manganese
0.111mg
0.116mg
0%
Trans fat
0.157g
N/A
Polyunsaturated fat
1.011g
0.989g
0%
Tryptophan
0.048mg
0%
Threonine
0.193mg
0%
Isoleucine
0.207mg
0%
Leucine
0.671mg
0%
Lysine
0.228mg
0%
Methionine
0.131mg
0%
Phenylalanine
0.276mg
0%
Valine
0.276mg
0%
Histidine
0.166mg
0%
Omega-3 - EPA
0g
0.003g
N/A
Omega-3 - ALA
0.065g
N/A
Omega-3 - DPA
0g
0.003g
N/A
Omega-6 - Gamma-linoleic acid
0.002g
N/A
Omega-6 - Dihomo-gamma-linoleic acid
0.005g
N/A
Omega-6 - Eicosadienoic acid
0.003g
N/A
Omega-6 - Linoleic acid
0.825g
N/A
Macronutrient Comparison
Macronutrient breakdown side-by-side comparison
3
33%
26%
11%
23%
7%
Protein:
33.2 g
Fats:
25.6 g
Carbs:
11 g
Water:
23.36 g
Other:
6.84 g
2
5%
5%
37%
51%
Protein:
5.48 g
Fats:
5.38 g
Carbs:
37.14 g
Water:
50.8 g
Other:
1.2 g
Contains
more
Protein Protein
+505.8%
Contains
more
Fats Fats
+375.8%
Contains
more
Other Other
+470%
Contains
more
Carbs Carbs
+237.6%
Contains
more
Water Water
+117.5%
Fat Type Comparison
Fat type breakdown side-by-side comparison
2
47%
49%
4%
Saturated fat:
Sat. Fat
10.85 g
Monounsaturated fat:
Mono. Fat
11.305 g
Polyunsaturated fat:
Poly. Fat
1.011 g
1
54%
28%
18%
Saturated fat:
Sat. Fat
2.902 g
Monounsaturated fat:
Mono. Fat
1.514 g
Polyunsaturated fat:
Poly. Fat
0.989 g
Contains
more
Mono. Fat Monounsaturated fat
+646.7%
Contains
less
Sat. Fat Saturated fat
-73.3%
~equal in
Polyunsaturated fat
~0.989g