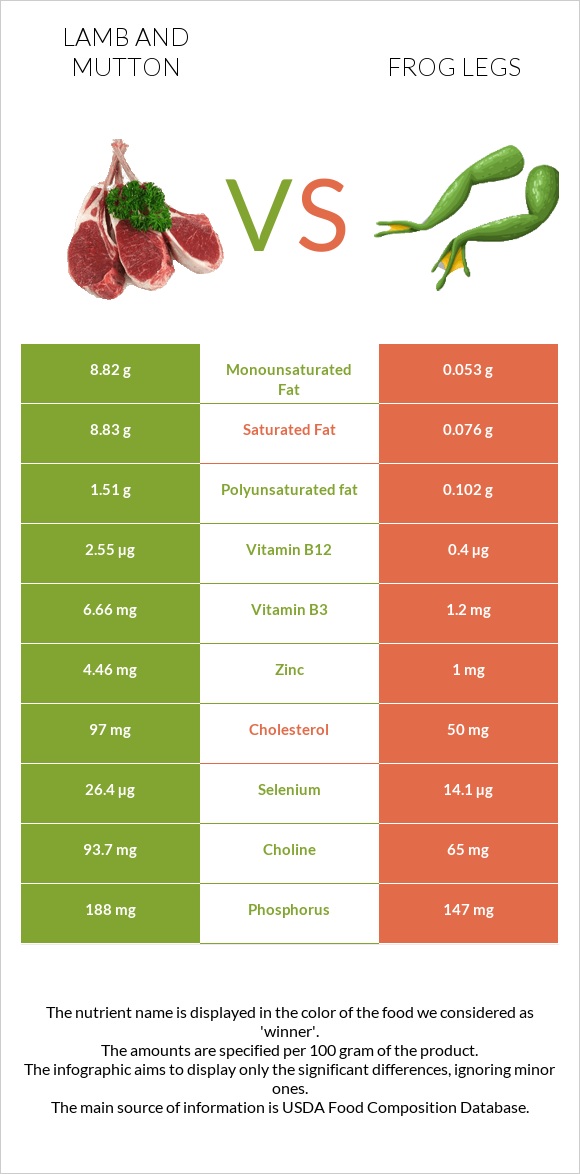
Important differences between lamb and frog legs Lamb has more vitamin B12, vitamin B3, zinc, selenium, phosphorus, and choline; however, frog legs are richer in copper and vitamin E. Lamb's daily need coverage for vitamin B12 is 90% more. Lamb contains 116 times more saturated fat than frog legs. Lamb contains 8.83g of saturated fat, while frog legs contain 0.076g. The food varieties used in the comparison are Lamb, domestic, composite of trimmed retail cuts, separable lean, and fat, trimmed to 1/4" fat, choice, cooked and Frog legs, raw .
Infographic
Mineral Comparison
Mineral comparison score is based on the number of minerals by which one or the other food is richer. The "coverage" charts below show how much of the daily needs can be covered by 300 grams of the food.
6
100 g
300 g
3 oz - 85g 1 piece, cooked, excluding refuse (yield from 1 lb raw meat with refuse) - 242g
Magnesium
Magnesium
Calcium
Calcium
Potassium
Potassium
Iron
Iron
Copper
Copper
Zinc
Zinc
Phosphorus
Phosphorus
Sodium
Sodium
Manganese
Manganese
Selenium
Selenium
16%
5.1%
27%
71%
40%
122%
81%
9.4%
2.9%
144%
2
100 g
300 g
1 leg - 45g
Magnesium
Magnesium
Calcium
Calcium
Potassium
Potassium
Iron
Iron
Copper
Copper
Zinc
Zinc
Phosphorus
Phosphorus
Sodium
Sodium
Manganese
Manganese
Selenium
Selenium
14%
5.4%
25%
56%
83%
27%
63%
7.6%
0%
77%
Vitamin Comparison
Vitamin comparison score is based on the number of vitamins by which one or the other food is richer. The "coverage" charts below show how much of the daily needs can be covered by 300 grams of the food.
5
100 g
300 g
3 oz - 85g 1 piece, cooked, excluding refuse (yield from 1 lb raw meat with refuse) - 242g
Vitamin C
Vit. C
Vitamin D
Vit. D
Vitamin A
Vit. A
Vitamin E
Vit. E
Vitamin B1
Vit. B1
Vitamin B2
Vit. B2
Vitamin B3
Vit. B3
Vitamin B5
Vit. B5
Vitamin B6
Vit. B6
Vitamin B12
Vit. B12
Vitamin K
Vit. K
Folate
Folate
0%
1.5%
0%
2.8%
25%
58%
125%
40%
30%
319%
12%
14%
4
100 g
300 g
1 leg - 45g
Vitamin C
Vit. C
Vitamin D
Vit. D
Vitamin A
Vit. A
Vitamin E
Vit. E
Vitamin B1
Vit. B1
Vitamin B2
Vit. B2
Vitamin B3
Vit. B3
Vitamin B5
Vit. B5
Vitamin B6
Vit. B6
Vitamin B12
Vit. B12
Vitamin K
Vit. K
Folate
Folate
0%
3%
5%
20%
35%
58%
23%
0%
28%
50%
0.25%
11%
All nutrients comparison - raw data values
Nutrient
DV% diff.
Vitamin B12
2.55µg
0.4µg
90%
Saturated fat
8.83g
0.076g
40%
Vitamin B3
6.66mg
1.2mg
34%
Fats
20.94g
0.3g
32%
Zinc
4.46mg
1mg
31%
Selenium
26.4µg
14.1µg
22%
Monounsaturated fat
8.82g
0.053g
22%
Protein
24.52g
16.4g
16%
Cholesterol
97mg
50mg
16%
Copper
0.119mg
0.25mg
15%
Vitamin B5
0.66mg
13%
Calories
294kcal
73kcal
11%
Polyunsaturated fat
1.51g
0.102g
9%
Phosphorus
188mg
147mg
6%
Vitamin E
0.14mg
1mg
6%
Iron
1.88mg
1.5mg
5%
Choline
93.7mg
65mg
5%
Vitamin K
4.6µg
0.1µg
4%
Vitamin B1
0.1mg
0.14mg
3%
Vitamin A
0µg
15µg
2%
Vitamin D*
2 IU
8 IU
1%
Vitamin D
0.1µg
0.2µg
1%
Magnesium
23mg
20mg
1%
Potassium
310mg
285mg
1%
Sodium
72mg
58mg
1%
Manganese
0.022mg
1%
Vitamin B6
0.13mg
0.12mg
1%
Folate
18µg
15µg
1%
Protein per 100 calories
8.3g
22g
N/A
Calories per 10 g protein
120kcal
45kcal
N/A
Weight per 100 calories
34g
137g
N/A
Unsaturated / Saturated Fat ratio
1.2
2
N/A
Calcium
17mg
18mg
0%
Vitamin B2
0.25mg
0.25mg
0%
Tryptophan
0.287mg
0%
Threonine
1.05mg
0%
Isoleucine
1.183mg
0%
Leucine
1.908mg
0%
Lysine
2.166mg
0%
Methionine
0.629mg
0%
Phenylalanine
0.998mg
0%
Valine
1.323mg
0%
Histidine
0.777mg
0%
Omega-3 - EPA
0g
0.014g
N/A
Omega-3 - DHA
0g
0.02g
N/A
Omega-3 - DPA
0g
0.007g
N/A
Macronutrient Comparison
Macronutrient breakdown side-by-side comparison
2
25%
21%
54%
Protein:
24.52 g
Fats:
20.94 g
Carbs:
0 g
Water:
53.72 g
Other:
0.82 g
2
16%
82%
Protein:
16.4 g
Fats:
0.3 g
Carbs:
0 g
Water:
81.9 g
Other:
1.4 g
Contains
more
Protein Protein
+49.5%
Contains
more
Fats Fats
+6880%
Contains
more
Water Water
+52.5%
Contains
more
Other Other
+70.7%
Fat Type Comparison
Fat type breakdown side-by-side comparison
2
46%
46%
8%
Saturated fat:
Sat. Fat
8.83 g
Monounsaturated fat:
Mono. Fat
8.82 g
Polyunsaturated fat:
Poly. Fat
1.51 g
1
33%
23%
44%
Saturated fat:
Sat. Fat
0.076 g
Monounsaturated fat:
Mono. Fat
0.053 g
Polyunsaturated fat:
Poly. Fat
0.102 g
Contains
more
Mono. Fat Monounsaturated fat
+16541.5%
Contains
more
Poly. Fat Polyunsaturated fat
+1380.4%
Contains
less
Sat. Fat Saturated fat
-99.1%