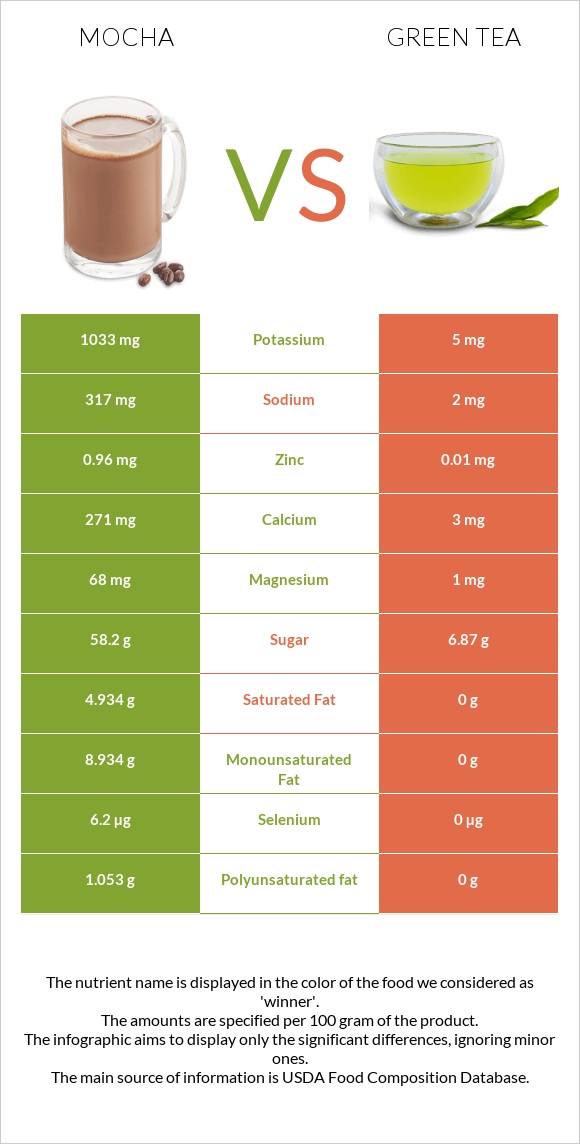
Important differences between mocha and green tea Green tea has less copper, phosphorus, potassium, calcium, vitamin B12, magnesium, vitamin B3, and manganese. Mocha's daily need coverage for copper is 48% more. Green tea is lower in saturated fat. The food varieties used in the comparison are Beverages, coffee, instant, mocha, sweetened and Beverages, tea, green, ready to drink, ginseng, and honey, sweetened .
Infographic
Mineral Comparison
Mineral comparison score is based on the number of minerals by which one or the other food is richer. The "coverage" charts below show how much of the daily needs can be covered by 300 grams of the food.
8
100 g
300 g
1 serving 2 tbsp - 13g
Magnesium
Magnesium
Calcium
Calcium
Potassium
Potassium
Iron
Iron
Copper
Copper
Zinc
Zinc
Phosphorus
Phosphorus
Sodium
Sodium
Manganese
Manganese
Selenium
Selenium
49%
81%
91%
0%
145%
26%
108%
41%
58%
34%
2
100 g
300 g
1 cup - 260g
Magnesium
Magnesium
Calcium
Calcium
Potassium
Potassium
Iron
Iron
Copper
Copper
Zinc
Zinc
Phosphorus
Phosphorus
Sodium
Sodium
Manganese
Manganese
Selenium
Selenium
0.71%
0.9%
0.44%
0.75%
1.7%
0.27%
0%
0.26%
16%
0%
Vitamin Comparison
Vitamin comparison score is based on the number of vitamins by which one or the other food is richer. The "coverage" charts below show how much of the daily needs can be covered by 300 grams of the food.
8
100 g
300 g
1 serving 2 tbsp - 13g
Vitamin C
Vit. C
Vitamin D
Vit. D
Vitamin A
Vit. A
Vitamin E
Vit. E
Vitamin B1
Vit. B1
Vitamin B2
Vit. B2
Vitamin B3
Vit. B3
Vitamin B5
Vit. B5
Vitamin B6
Vit. B6
Vitamin B12
Vit. B12
Vitamin K
Vit. K
Folate
Folate
2%
0%
0.33%
0%
7.8%
6.5%
42%
3.1%
13%
56%
3.8%
6.8%
2
100 g
300 g
1 cup - 260g
Vitamin C
Vit. C
Vitamin D
Vit. D
Vitamin A
Vit. A
Vitamin E
Vit. E
Vitamin B1
Vit. B1
Vitamin B2
Vit. B2
Vitamin B3
Vit. B3
Vitamin B5
Vit. B5
Vitamin B6
Vit. B6
Vitamin B12
Vit. B12
Vitamin K
Vit. K
Folate
Folate
26%
0%
0%
0%
10%
0%
0%
0%
0%
0%
0%
0%
All nutrients comparison - raw data values
Nutrient
DV% diff.
Caffeine
360mg
4mg
89%
Copper
0.435mg
0.005mg
48%
Phosphorus
251mg
0mg
36%
Potassium
1033mg
5mg
30%
Calcium
271mg
3mg
27%
Fats
15.87g
0.18g
24%
Calories
460kcal
30kcal
22%
Carbs
74.04g
7.16g
22%
Saturated fat
4.934g
0g
22%
Monounsaturated fat
8.934g
0g
22%
Vitamin B12
0.45µg
0µg
19%
Magnesium
68mg
1mg
16%
Sodium
317mg
2mg
14%
Manganese
0.445mg
0.12mg
14%
Vitamin B3
2.263mg
0mg
14%
Protein
5.29g
0g
11%
Selenium
6.2µg
0µg
11%
Zinc
0.96mg
0.01mg
9%
Vitamin C
0.6mg
7.7mg
8%
Fiber
1.9g
0g
8%
Polyunsaturated fat
1.053g
0g
7%
Choline
31.3mg
0mg
6%
Vitamin B6
0.055mg
0mg
4%
Fructose
3.59g
4%
Vitamin B2
0.028mg
0mg
2%
Folate
9µg
0µg
2%
Vitamin B1
0.031mg
0.04mg
1%
Vitamin B5
0.052mg
0mg
1%
Vitamin K
1.5µg
0µg
1%
Protein per 100 calories
1.2g
0g
N/A
Calories per 10 g protein
870kcal
N/A
Weight per 100 calories
22g
333g
N/A
Unsaturated / Saturated Fat ratio
2
N/A
Net carbs
72.14g
7.16g
N/A
Iron
0mg
0.02mg
0%
Sugar
58.2g
6.87g
N/A
Vitamin A
1µg
0µg
0%
Macronutrient Comparison
Macronutrient breakdown side-by-side comparison
4
5%
16%
74%
2%
3%
Protein:
5.29 g
Fats:
15.87 g
Carbs:
74.04 g
Water:
1.7 g
Other:
3.1 g
1
7%
93%
Protein:
0 g
Fats:
0.18 g
Carbs:
7.16 g
Water:
92.65 g
Other:
0.01 g
Contains
more
Protein Protein
+∞%
Contains
more
Fats Fats
+8716.7%
Contains
more
Carbs Carbs
+934.1%
Contains
more
Other Other
+30900%
Contains
more
Water Water
+5350%