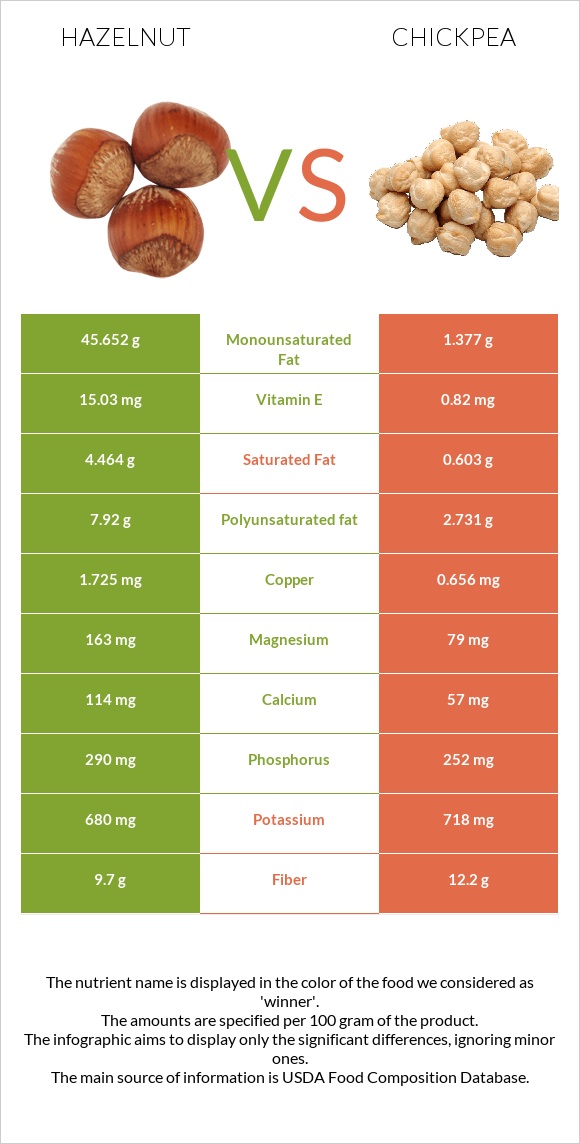
What are the differences between hazelnut and chickpeas? Hazelnut is higher in manganese, copper, vitamin E, vitamin B1, vitamin B6, magnesium, iron, and phosphorus, yet chickpeas are higher in folate. Hazelnut's daily need coverage for manganese is 224% more. Hazelnut has 43 times more vitamin E than chickpeas. While hazelnut has 15.03mg of vitamin E, chickpeas have only 0.35mg. The amount of saturated fat in chickpeas is lower. The glycemic index of hazelnut is lower. We used Nuts, hazelnuts or filberts and Chickpeas (garbanzo beans, bengal gram), mature seeds, cooked, boiled, without salt types in this article.
Infographic
Mineral Comparison
Mineral comparison score is based on the number of minerals by which one or the other food is richer. The "coverage" charts below show how much of the daily needs can be covered by 300 grams of the food.
9
100 g
300 g
10 nuts - 14g 1 oz (21 whole kernels) - 28.35g 1 cup, ground - 75g 1 cup, chopped - 115g 1 cup, whole - 135g
Magnesium
Magnesium
Calcium
Calcium
Potassium
Potassium
Iron
Iron
Copper
Copper
Zinc
Zinc
Phosphorus
Phosphorus
Sodium
Sodium
Manganese
Manganese
Selenium
Selenium
116%
34%
60%
176%
575%
67%
124%
0%
805%
13%
1
100 g
300 g
1 cup - 164g
Magnesium
Magnesium
Calcium
Calcium
Potassium
Potassium
Iron
Iron
Copper
Copper
Zinc
Zinc
Phosphorus
Phosphorus
Sodium
Sodium
Manganese
Manganese
Selenium
Selenium
34%
15%
26%
108%
117%
42%
72%
0.91%
134%
20%
Vitamin Comparison
Vitamin comparison score is based on the number of vitamins by which one or the other food is richer. The "coverage" charts below show how much of the daily needs can be covered by 300 grams of the food.
8
100 g
300 g
10 nuts - 14g 1 oz (21 whole kernels) - 28.35g 1 cup, ground - 75g 1 cup, chopped - 115g 1 cup, whole - 135g
Vitamin C
Vit. C
Vitamin D
Vit. D
Vitamin A
Vit. A
Vitamin E
Vit. E
Vitamin B1
Vit. B1
Vitamin B2
Vit. B2
Vitamin B3
Vit. B3
Vitamin B5
Vit. B5
Vitamin B6
Vit. B6
Vitamin B12
Vit. B12
Vitamin K
Vit. K
Folate
Folate
21%
0%
0.33%
301%
161%
26%
34%
55%
130%
0%
36%
85%
1
100 g
300 g
1 cup - 164g
Vitamin C
Vit. C
Vitamin D
Vit. D
Vitamin A
Vit. A
Vitamin E
Vit. E
Vitamin B1
Vit. B1
Vitamin B2
Vit. B2
Vitamin B3
Vit. B3
Vitamin B5
Vit. B5
Vitamin B6
Vit. B6
Vitamin B12
Vit. B12
Vitamin K
Vit. K
Folate
Folate
4.3%
0%
0.33%
7%
29%
15%
9.9%
17%
32%
0%
10%
129%
All nutrients comparison - raw data values
Nutrient
DV% diff.
Manganese
6.175mg
1.03mg
224%
Copper
1.725mg
0.352mg
153%
Monounsaturated fat
45.652g
0.583g
113%
Vitamin E
15.03mg
0.35mg
98%
Fats
60.75g
2.59g
89%
Polyunsaturated fat
7.92g
1.156g
45%
Vitamin B1
0.643mg
0.116mg
44%
Vitamin B6
0.563mg
0.139mg
33%
Magnesium
163mg
48mg
27%
Calories
628kcal
164kcal
23%
Iron
4.7mg
2.89mg
23%
Saturated fat
4.464g
0.269g
19%
Phosphorus
290mg
168mg
17%
Folate
113µg
172µg
15%
Vitamin B5
0.918mg
0.286mg
13%
Protein
14.95g
8.86g
12%
Potassium
680mg
291mg
11%
Vitamin K
14.2µg
4µg
9%
Fiber
9.7g
7.6g
8%
Zinc
2.45mg
1.53mg
8%
Vitamin B3
1.8mg
0.526mg
8%
Calcium
114mg
49mg
7%
Vitamin C
6.3mg
1.3mg
6%
Carbs
16.7g
27.42g
4%
Vitamin B2
0.113mg
0.063mg
4%
Selenium
2.4µg
3.7µg
2%
Choline
45.6mg
42.8mg
1%
Protein per 100 calories
2.4g
5.4g
N/A
Calories per 10 g protein
420kcal
185kcal
N/A
Weight per 100 calories
16g
61g
N/A
Unsaturated / Saturated Fat ratio
12
6.5
N/A
Net carbs
7g
19.82g
N/A
Sugar
4.34g
4.8g
N/A
Starch
0.48g
0%
Sodium
0mg
7mg
0%
Vitamin A
1µg
1µg
0%
Tryptophan
0.193mg
0.085mg
0%
Threonine
0.497mg
0.329mg
0%
Isoleucine
0.545mg
0.38mg
0%
Leucine
1.063mg
0.631mg
0%
Lysine
0.42mg
0.593mg
0%
Methionine
0.221mg
0.116mg
0%
Phenylalanine
0.663mg
0.475mg
0%
Valine
0.701mg
0.372mg
0%
Histidine
0.432mg
0.244mg
0%
Fructose
0.07g
0%
Macronutrient Comparison
Macronutrient breakdown side-by-side comparison
3
15%
61%
17%
5%
2%
Protein:
14.95 g
Fats:
60.75 g
Carbs:
16.7 g
Water:
5.31 g
Other:
2.29 g
2
9%
3%
27%
60%
Protein:
8.86 g
Fats:
2.59 g
Carbs:
27.42 g
Water:
60.21 g
Other:
0.92 g
Contains
more
Protein Protein
+68.7%
Contains
more
Fats Fats
+2245.6%
Contains
more
Other Other
+148.9%
Contains
more
Carbs Carbs
+64.2%
Contains
more
Water Water
+1033.9%
Fat Type Comparison
Fat type breakdown side-by-side comparison
2
8%
79%
14%
Saturated fat:
Sat. Fat
4.464 g
Monounsaturated fat:
Mono. Fat
45.652 g
Polyunsaturated fat:
Poly. Fat
7.92 g
1
13%
29%
58%
Saturated fat:
Sat. Fat
0.269 g
Monounsaturated fat:
Mono. Fat
0.583 g
Polyunsaturated fat:
Poly. Fat
1.156 g
Contains
more
Mono. Fat Monounsaturated fat
+7730.5%
Contains
more
Poly. Fat Polyunsaturated fat
+585.1%
Contains
less
Sat. Fat Saturated fat
-94%