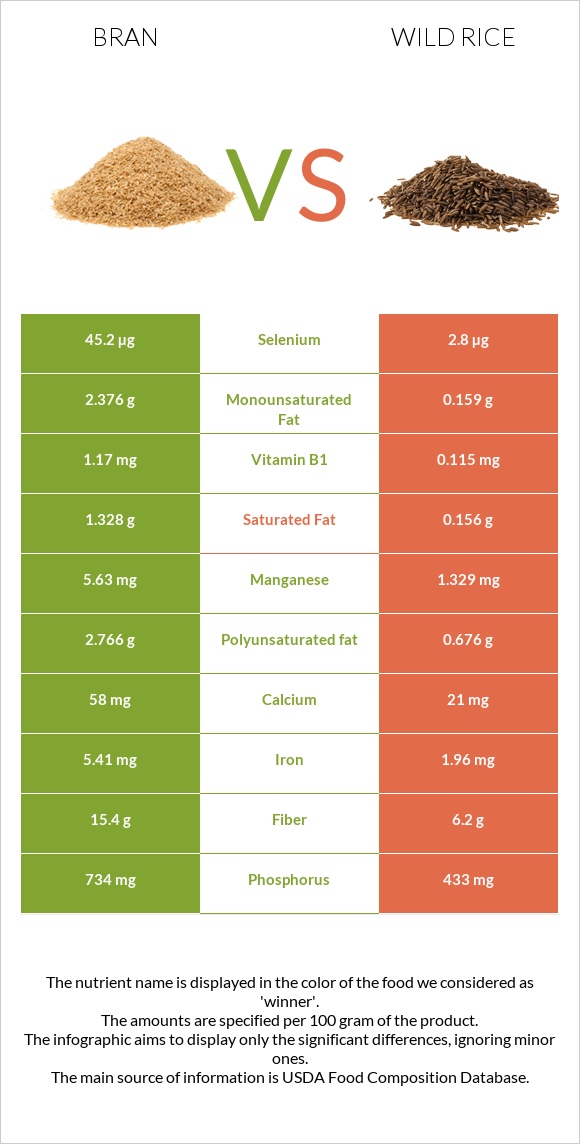
Summary of differences between bran and wild rice Bran has more manganese, selenium, vitamin B1, and phosphorus; however, wild rice is higher in vitamin B6, zinc, vitamin B3, and copper. Bran covers your daily need for manganese, 30% more than wild rice. Bran has 10 times more selenium than wild rice. While bran has 7.7µg of selenium, wild rice has only 0.8µg. These are the specific foods used in this comparison Oat bran, cooked and Wild rice, cooked .
Infographic
Mineral Comparison
Mineral comparison score is based on the number of minerals by which one or the other food is richer. The "coverage" charts below show how much of the daily needs can be covered by 300 grams of the food.
7
100 g
300 g
1 cup - 219g
Magnesium
Magnesium
Calcium
Calcium
Potassium
Potassium
Iron
Iron
Copper
Copper
Zinc
Zinc
Phosphorus
Phosphorus
Sodium
Sodium
Manganese
Manganese
Selenium
Selenium
29%
3%
8.1%
33%
22%
14%
51%
0.13%
126%
42%
2
100 g
300 g
1 cup - 164g
Magnesium
Magnesium
Calcium
Calcium
Potassium
Potassium
Iron
Iron
Copper
Copper
Zinc
Zinc
Phosphorus
Phosphorus
Sodium
Sodium
Manganese
Manganese
Selenium
Selenium
23%
0.9%
8.9%
23%
40%
37%
35%
0.39%
37%
4.4%
Vitamin Comparison
Vitamin comparison score is based on the number of vitamins by which one or the other food is richer. The "coverage" charts below show how much of the daily needs can be covered by 300 grams of the food.
2
100 g
300 g
1 cup - 219g
Vitamin C
Vit. C
Vitamin D
Vit. D
Vitamin A
Vit. A
Vitamin E
Vit. E
Vitamin B1
Vit. B1
Vitamin B2
Vit. B2
Vitamin B3
Vit. B3
Vitamin B5
Vit. B5
Vitamin B6
Vit. B6
Vitamin B12
Vit. B12
Vitamin K
Vit. K
Folate
Folate
0%
0%
0%
0%
40%
7.8%
2.7%
13%
5.8%
0%
0%
4.5%
6
100 g
300 g
1 cup - 164g
Vitamin C
Vit. C
Vitamin D
Vit. D
Vitamin A
Vit. A
Vitamin E
Vit. E
Vitamin B1
Vit. B1
Vitamin B2
Vit. B2
Vitamin B3
Vit. B3
Vitamin B5
Vit. B5
Vitamin B6
Vit. B6
Vitamin B12
Vit. B12
Vitamin K
Vit. K
Folate
Folate
0%
0%
0%
4.8%
13%
20%
24%
9.2%
31%
0%
1.3%
20%
All nutrients comparison - raw data values
Nutrient
DV% diff.
Manganese
0.964mg
0.282mg
30%
Selenium
7.7µg
0.8µg
13%
Vitamin B1
0.16mg
0.052mg
9%
Vitamin B6
0.025mg
0.135mg
8%
Zinc
0.53mg
1.34mg
7%
Vitamin B3
0.144mg
1.287mg
7%
Copper
0.066mg
0.121mg
6%
Phosphorus
119mg
82mg
5%
Folate
6µg
26µg
5%
Iron
0.88mg
0.6mg
4%
Vitamin B2
0.034mg
0.087mg
4%
Calories
40kcal
101kcal
3%
Carbs
11.44g
21.34g
3%
Fiber
2.6g
1.8g
3%
Protein
3.21g
3.99g
2%
Magnesium
40mg
32mg
2%
Vitamin E
0.24mg
2%
Choline
10.2mg
2%
Fats
0.86g
0.34g
1%
Calcium
10mg
3mg
1%
Vitamin B5
0.217mg
0.154mg
1%
Saturated fat
0.163g
0.049g
1%
Monounsaturated fat
0.291g
0.05g
1%
Polyunsaturated fat
0.339g
0.213g
1%
Protein per 100 calories
8g
4g
N/A
Calories per 10 g protein
125kcal
253kcal
N/A
Weight per 100 calories
250g
99g
N/A
Net carbs
8.84g
19.54g
N/A
Potassium
92mg
101mg
0%
Sugar
0.73g
N/A
Sodium
1mg
3mg
0%
Vitamin K
0.5µg
0%
Tryptophan
0.057mg
0.049mg
0%
Threonine
0.086mg
0.127mg
0%
Isoleucine
0.114mg
0.167mg
0%
Leucine
0.235mg
0.276mg
0%
Lysine
0.13mg
0.17mg
0%
Methionine
0.057mg
0.119mg
0%
Phenylalanine
0.155mg
0.195mg
0%
Valine
0.165mg
0.232mg
0%
Histidine
0.07mg
0.104mg
0%
Fructose
0.2g
0%
Macronutrient Comparison
Macronutrient breakdown side-by-side comparison
3
3%
11%
84%
Protein:
3.21 g
Fats:
0.86 g
Carbs:
11.44 g
Water:
84 g
Other:
0.49 g
2
4%
21%
74%
Protein:
3.99 g
Fats:
0.34 g
Carbs:
21.34 g
Water:
73.93 g
Other:
0.4 g
Contains
more
Fats Fats
+152.9%
Contains
more
Water Water
+13.6%
Contains
more
Other Other
+22.5%
Contains
more
Protein Protein
+24.3%
Contains
more
Carbs Carbs
+86.5%
Fat Type Comparison
Fat type breakdown side-by-side comparison
2
21%
37%
43%
Saturated fat:
Sat. Fat
0.163 g
Monounsaturated fat:
Mono. Fat
0.291 g
Polyunsaturated fat:
Poly. Fat
0.339 g
1
16%
16%
68%
Saturated fat:
Sat. Fat
0.049 g
Monounsaturated fat:
Mono. Fat
0.05 g
Polyunsaturated fat:
Poly. Fat
0.213 g
Contains
more
Mono. Fat Monounsaturated fat
+482%
Contains
more
Poly. Fat Polyunsaturated fat
+59.2%
Contains
less
Sat. Fat Saturated fat
-69.9%