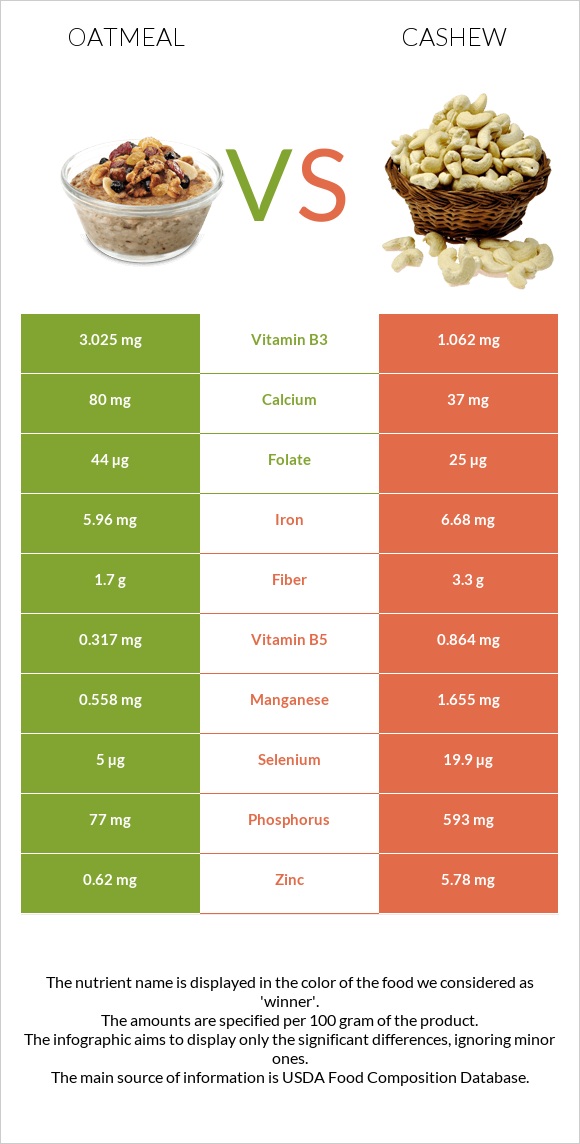
Significant differences between oatmeal and cashew The amount of copper, phosphorus, magnesium, manganese, zinc, vitamin K, selenium, potassium, and vitamin B1 in cashew is higher than in oatmeal. Cashew covers your daily copper needs 237% more than oatmeal. Oatmeal contains less saturated fat. Oatmeal has a higher glycemic index. The glycemic index of oatmeal is 79, while the glycemic index of cashew is 25. Specific food types used in this comparison are Cereals, oats, instant, fortified, plain, prepared with water (boiling water added or microwaved) and Nuts, cashew nuts, raw .
Infographic
Mineral Comparison
Mineral comparison score is based on the number of minerals by which one or the other food is richer. The "coverage" charts below show how much of the daily needs can be covered by 300 grams of the food.
1
100 g
300 g
1 oz, dry, yields - 177g 1 packet, dry, yields - 177g 1 cup, cooked - 234g 1 cup, dry, yields - 501g
Magnesium
Magnesium
Calcium
Calcium
Potassium
Potassium
Iron
Iron
Copper
Copper
Zinc
Zinc
Phosphorus
Phosphorus
Sodium
Sodium
Manganese
Manganese
Selenium
Selenium
19%
24%
5.4%
224%
22%
17%
33%
6.4%
73%
27%
9
100 g
300 g
1 oz - 28.35g
Magnesium
Magnesium
Calcium
Calcium
Potassium
Potassium
Iron
Iron
Copper
Copper
Zinc
Zinc
Phosphorus
Phosphorus
Sodium
Sodium
Manganese
Manganese
Selenium
Selenium
209%
11%
58%
251%
732%
158%
254%
1.6%
216%
109%
Vitamin Comparison
Vitamin comparison score is based on the number of vitamins by which one or the other food is richer. The "coverage" charts below show how much of the daily needs can be covered by 300 grams of the food.
4
100 g
300 g
1 oz, dry, yields - 177g 1 packet, dry, yields - 177g 1 cup, cooked - 234g 1 cup, dry, yields - 501g
Vitamin C
Vit. C
Vitamin D
Vit. D
Vitamin A
Vit. A
Vitamin E
Vit. E
Vitamin B1
Vit. B1
Vitamin B2
Vit. B2
Vitamin B3
Vit. B3
Vitamin B5
Vit. B5
Vitamin B6
Vit. B6
Vitamin B12
Vit. B12
Vitamin K
Vit. K
Folate
Folate
0%
0%
43%
1.4%
65%
50%
57%
19%
67%
0%
1%
33%
6
100 g
300 g
1 oz - 28.35g
Vitamin C
Vit. C
Vitamin D
Vit. D
Vitamin A
Vit. A
Vitamin E
Vit. E
Vitamin B1
Vit. B1
Vitamin B2
Vit. B2
Vitamin B3
Vit. B3
Vitamin B5
Vit. B5
Vitamin B6
Vit. B6
Vitamin B12
Vit. B12
Vitamin K
Vit. K
Folate
Folate
1.7%
0%
0%
18%
106%
13%
20%
52%
96%
0%
85%
19%
All nutrients comparison - raw data values
Nutrient
DV% diff.
Copper
0.066mg
2.195mg
237%
Phosphorus
77mg
593mg
74%
Fats
1.36g
43.85g
65%
Magnesium
26mg
292mg
63%
Monounsaturated fat
0.391g
23.797g
59%
Polyunsaturated fat
0.426g
7.845g
49%
Manganese
0.558mg
1.655mg
48%
Zinc
0.62mg
5.78mg
47%
Saturated fat
0.226g
7.783g
34%
Protein
2.37g
18.22g
32%
Vitamin K
0.4µg
34.1µg
28%
Selenium
5µg
19.9µg
27%
Calories
68kcal
553kcal
24%
Potassium
61mg
660mg
18%
Vitamin A
130µg
0µg
14%
Vitamin B1
0.26mg
0.423mg
14%
Vitamin B2
0.215mg
0.058mg
12%
Vitamin B3
3.025mg
1.062mg
12%
Vitamin B5
0.317mg
0.864mg
11%
Vitamin B6
0.29mg
0.417mg
10%
Iron
5.96mg
6.68mg
9%
Carbs
11.67g
30.19g
6%
Fiber
1.7g
3.3g
6%
Vitamin E
0.07mg
0.9mg
6%
Starch
10.37g
23.49g
5%
Folate
44µg
25µg
5%
Calcium
80mg
37mg
4%
Sodium
49mg
12mg
2%
Vitamin C
0mg
0.5mg
1%
Choline
4.7mg
1%
Protein per 100 calories
3.5g
3.3g
N/A
Calories per 10 g protein
287kcal
304kcal
N/A
Weight per 100 calories
147g
18g
N/A
Unsaturated / Saturated Fat ratio
3.6
4.1
N/A
Net carbs
9.97g
26.89g
N/A
Sugar
0.46g
5.91g
N/A
Trans fat
0.003g
N/A
Tryptophan
0.04mg
0.287mg
0%
Threonine
0.083mg
0.688mg
0%
Isoleucine
0.105mg
0.789mg
0%
Leucine
0.2mg
1.472mg
0%
Lysine
0.135mg
0.928mg
0%
Methionine
0.04mg
0.362mg
0%
Phenylalanine
0.13mg
0.951mg
0%
Valine
0.151mg
1.094mg
0%
Histidine
0.057mg
0.456mg
0%
Fructose
0g
0.05g
0%
Macronutrient Comparison
Macronutrient breakdown side-by-side comparison
1
2%
12%
84%
Protein:
2.37 g
Fats:
1.36 g
Carbs:
11.67 g
Water:
84.03 g
Other:
0.57 g
4
18%
44%
30%
5%
3%
Protein:
18.22 g
Fats:
43.85 g
Carbs:
30.19 g
Water:
5.2 g
Other:
2.54 g
Contains
more
Water Water
+1516%
Contains
more
Protein Protein
+668.8%
Contains
more
Fats Fats
+3124.3%
Contains
more
Carbs Carbs
+158.7%
Contains
more
Other Other
+345.6%
Fat Type Comparison
Fat type breakdown side-by-side comparison
1
22%
37%
41%
Saturated fat:
Sat. Fat
0.226 g
Monounsaturated fat:
Mono. Fat
0.391 g
Polyunsaturated fat:
Poly. Fat
0.426 g
2
20%
60%
20%
Saturated fat:
Sat. Fat
7.783 g
Monounsaturated fat:
Mono. Fat
23.797 g
Polyunsaturated fat:
Poly. Fat
7.845 g
Contains
less
Sat. Fat Saturated fat
-97.1%
Contains
more
Mono. Fat Monounsaturated fat
+5986.2%
Contains
more
Poly. Fat Polyunsaturated fat
+1741.5%
Carbohydrate type comparison
Carbohydrate type breakdown side-by-side comparison
1
96%
3%
Starch:
10.37 g
Sucrose:
0.29 g
Glucose:
0 g
Fructose:
0 g
Lactose:
0 g
Maltose:
0 g
Galactose:
0.16 g
4
80%
20%
Starch:
23.49 g
Sucrose:
5.81 g
Glucose:
0.05 g
Fructose:
0.05 g
Lactose:
0 g
Maltose:
0 g
Galactose:
0 g
Contains
more
Galactose Galactose
+∞%
Contains
more
Starch Starch
+126.5%
Contains
more
Sucrose Sucrose
+1903.4%
Contains
more
Glucose Glucose
+∞%
Contains
more
Fructose Fructose
+∞%
~equal in
Lactose
~0g
~equal in
Maltose
~0g