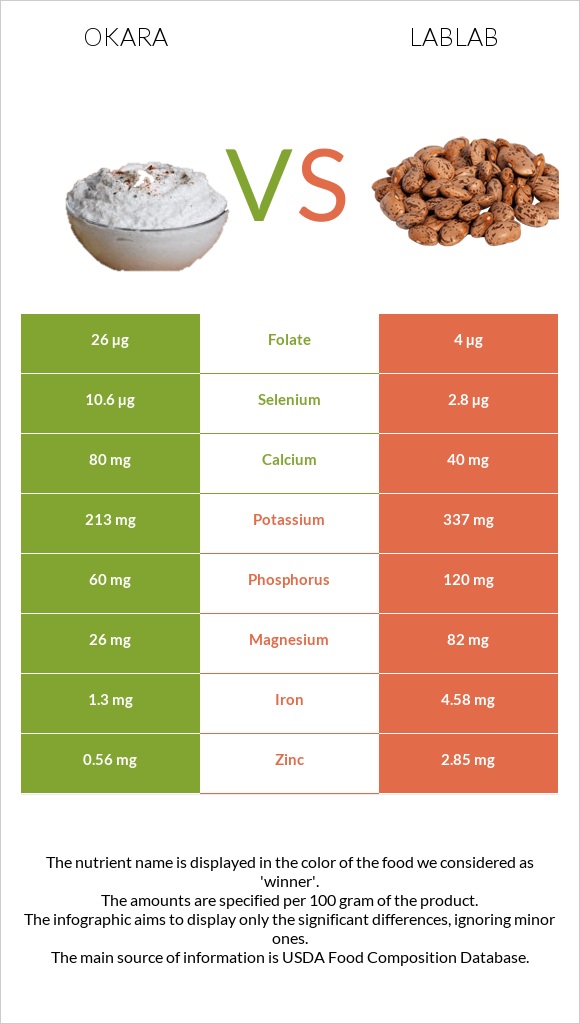
How are okara and lablab different? Okara is richer in selenium, vitamin B6, and folate, while lablab is higher in iron, vitamin B1, zinc, copper, magnesium, and phosphorus. Lablab covers your daily need for iron, 41% more than okara. Okara contains 7 times more folate than lablab. Okara contains 26µg of folate, while lablab contains 4µg. Okara and Hyacinth beans, mature seeds, cooked, boiled, without salt types were used in this article.
Infographic
Mineral Comparison
Mineral comparison score is based on the number of minerals by which one or the other food is richer. The "coverage" charts below show how much of the daily needs can be covered by 300 grams of the food.
2
100 g
300 g
1 cup - 122g
Magnesium
Magnesium
Calcium
Calcium
Potassium
Potassium
Iron
Iron
Copper
Copper
Zinc
Zinc
Phosphorus
Phosphorus
Sodium
Sodium
Manganese
Manganese
Selenium
Selenium
19%
24%
19%
49%
67%
15%
26%
1.2%
53%
58%
8
100 g
300 g
1 cup - 194g
Magnesium
Magnesium
Calcium
Calcium
Potassium
Potassium
Iron
Iron
Copper
Copper
Zinc
Zinc
Phosphorus
Phosphorus
Sodium
Sodium
Manganese
Manganese
Selenium
Selenium
59%
12%
30%
172%
114%
78%
51%
0.91%
63%
15%
Vitamin Comparison
Vitamin comparison score is based on the number of vitamins by which one or the other food is richer. The "coverage" charts below show how much of the daily needs can be covered by 300 grams of the food.
2
100 g
300 g
1 cup - 122g
Vitamin C
Vit. C
Vitamin D
Vit. D
Vitamin A
Vit. A
Vitamin E
Vit. E
Vitamin B1
Vit. B1
Vitamin B2
Vit. B2
Vitamin B3
Vit. B3
Vitamin B5
Vit. B5
Vitamin B6
Vit. B6
Vitamin B12
Vit. B12
Vitamin K
Vit. K
Folate
Folate
0%
0%
0%
0%
5%
4.6%
1.9%
5.3%
27%
0%
0%
20%
4
100 g
300 g
1 cup - 194g
Vitamin C
Vit. C
Vitamin D
Vit. D
Vitamin A
Vit. A
Vitamin E
Vit. E
Vitamin B1
Vit. B1
Vitamin B2
Vit. B2
Vitamin B3
Vit. B3
Vitamin B5
Vit. B5
Vitamin B6
Vit. B6
Vitamin B12
Vit. B12
Vitamin K
Vit. K
Folate
Folate
0%
0%
0%
0%
68%
8.5%
7.7%
19%
8.5%
0%
0%
3%
All nutrients comparison - raw data values
Nutrient
DV% diff.
Iron
1.3mg
4.58mg
41%
Zinc
0.56mg
2.85mg
21%
Vitamin B1
0.02mg
0.27mg
21%
Copper
0.2mg
0.341mg
16%
Selenium
10.6µg
2.8µg
14%
Magnesium
26mg
82mg
13%
Protein
3.52g
8.14g
9%
Phosphorus
60mg
120mg
9%
Vitamin B6
0.115mg
0.037mg
6%
Folate
26µg
4µg
6%
Vitamin B5
0.088mg
0.316mg
5%
Calcium
80mg
40mg
4%
Potassium
213mg
337mg
4%
Carbs
12.23g
20.69g
3%
Manganese
0.404mg
0.482mg
3%
Polyunsaturated fat
0.755g
0.245g
3%
Calories
76kcal
117kcal
2%
Fats
1.73g
0.58g
2%
Vitamin B3
0.1mg
0.411mg
2%
Vitamin B2
0.02mg
0.037mg
1%
Monounsaturated fat
0.295g
0.026g
1%
Protein per 100 calories
4.6g
7g
N/A
Calories per 10 g protein
216kcal
144kcal
N/A
Weight per 100 calories
132g
85g
N/A
Net carbs
12.23g
20.69g
N/A
Sodium
9mg
7mg
0%
Saturated fat
0.193g
0.099g
0%
Tryptophan
0.05mg
0.068mg
0%
Threonine
0.131mg
0.315mg
0%
Isoleucine
0.159mg
0.39mg
0%
Leucine
0.244mg
0.691mg
0%
Lysine
0.212mg
0.556mg
0%
Methionine
0.041mg
0.065mg
0%
Phenylalanine
0.157mg
0.41mg
0%
Valine
0.162mg
0.422mg
0%
Histidine
0.093mg
0.233mg
0%
Macronutrient Comparison
Macronutrient breakdown side-by-side comparison
2
4%
2%
12%
82%
Protein:
3.52 g
Fats:
1.73 g
Carbs:
12.23 g
Water:
81.64 g
Other:
0.88 g
3
8%
21%
69%
Protein:
8.14 g
Fats:
0.58 g
Carbs:
20.69 g
Water:
69.13 g
Other:
1.46 g
Contains
more
Fats Fats
+198.3%
Contains
more
Water Water
+18.1%
Contains
more
Protein Protein
+131.3%
Contains
more
Carbs Carbs
+69.2%
Contains
more
Other Other
+65.9%
Fat Type Comparison
Fat type breakdown side-by-side comparison
2
16%
24%
61%
Saturated fat:
Sat. Fat
0.193 g
Monounsaturated fat:
Mono. Fat
0.295 g
Polyunsaturated fat:
Poly. Fat
0.755 g
1
27%
7%
66%
Saturated fat:
Sat. Fat
0.099 g
Monounsaturated fat:
Mono. Fat
0.026 g
Polyunsaturated fat:
Poly. Fat
0.245 g
Contains
more
Mono. Fat Monounsaturated fat
+1034.6%
Contains
more
Poly. Fat Polyunsaturated fat
+208.2%
Contains
less
Sat. Fat Saturated fat
-48.7%