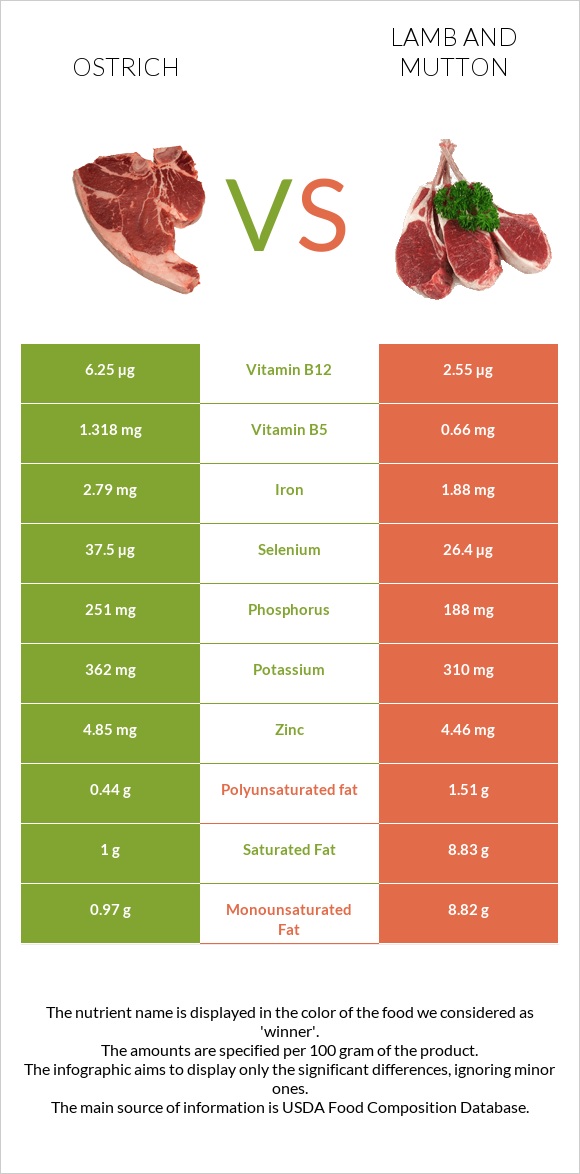
How are ostrich and lamb different? Ostrich is higher than lamb in vitamin B12, vitamin B6, selenium, vitamin B5, iron, vitamin B1, and phosphorus. Ostrich covers your daily need for vitamin B12, 154% more than lamb. Ostrich contains 4 times more vitamin B6 than lamb. Ostrich contains 0.545mg of vitamin B6, while lamb contains 0.13mg. Ostrich is lower in saturated fat. Ostrich, tip trimmed, cooked and Lamb, domestic, composite of trimmed retail cuts, separable lean, and fat, trimmed to 1/4" fat, choice, cooked types were used in this article.
Infographic
Mineral Comparison
Mineral comparison score is based on the number of minerals by which one or the other food is richer. The "coverage" charts below show how much of the daily needs can be covered by 300 grams of the food.
5
100 g
300 g
1 serving ( 3 oz ) - 85g
Magnesium
Magnesium
Calcium
Calcium
Potassium
Potassium
Iron
Iron
Copper
Copper
Zinc
Zinc
Phosphorus
Phosphorus
Sodium
Sodium
Manganese
Manganese
Selenium
Selenium
18%
1.8%
32%
105%
51%
132%
108%
10%
2.5%
205%
2
100 g
300 g
3 oz - 85g 1 piece, cooked, excluding refuse (yield from 1 lb raw meat with refuse) - 242g
Magnesium
Magnesium
Calcium
Calcium
Potassium
Potassium
Iron
Iron
Copper
Copper
Zinc
Zinc
Phosphorus
Phosphorus
Sodium
Sodium
Manganese
Manganese
Selenium
Selenium
16%
5.1%
27%
71%
40%
122%
81%
9.4%
2.9%
144%
Vitamin Comparison
Vitamin comparison score is based on the number of vitamins by which one or the other food is richer. The "coverage" charts below show how much of the daily needs can be covered by 300 grams of the food.
6
100 g
300 g
1 serving ( 3 oz ) - 85g
Vitamin C
Vit. C
Vitamin D
Vit. D
Vitamin A
Vit. A
Vitamin E
Vit. E
Vitamin B1
Vit. B1
Vitamin B2
Vit. B2
Vitamin B3
Vit. B3
Vitamin B5
Vit. B5
Vitamin B6
Vit. B6
Vitamin B12
Vit. B12
Vitamin K
Vit. K
Folate
Folate
0%
0%
0%
4.6%
58%
67%
134%
79%
126%
781%
0%
11%
3
100 g
300 g
3 oz - 85g 1 piece, cooked, excluding refuse (yield from 1 lb raw meat with refuse) - 242g
Vitamin C
Vit. C
Vitamin D
Vit. D
Vitamin A
Vit. A
Vitamin E
Vit. E
Vitamin B1
Vit. B1
Vitamin B2
Vit. B2
Vitamin B3
Vit. B3
Vitamin B5
Vit. B5
Vitamin B6
Vit. B6
Vitamin B12
Vit. B12
Vitamin K
Vit. K
Folate
Folate
0%
1.5%
0%
2.8%
25%
58%
125%
40%
30%
319%
12%
14%
All nutrients comparison - raw data values
Nutrient
DV% diff.
Vitamin B12
6.25µg
2.55µg
154%
Saturated fat
1g
8.83g
36%
Vitamin B6
0.545mg
0.13mg
32%
Fats
2.57g
20.94g
28%
Selenium
37.5µg
26.4µg
20%
Monounsaturated fat
0.97g
8.82g
20%
Choline
93.7mg
17%
Vitamin B5
1.318mg
0.66mg
13%
Iron
2.79mg
1.88mg
11%
Vitamin B1
0.232mg
0.1mg
11%
Phosphorus
251mg
188mg
9%
Protein
28.49g
24.52g
8%
Calories
145kcal
294kcal
7%
Polyunsaturated fat
0.44g
1.51g
7%
Cholesterol
85mg
97mg
4%
Copper
0.152mg
0.119mg
4%
Zinc
4.85mg
4.46mg
4%
Vitamin K
4.6µg
4%
Vitamin B2
0.292mg
0.25mg
3%
Vitamin B3
7.143mg
6.66mg
3%
Potassium
362mg
310mg
2%
Vitamin D
0.1µg
1%
Calcium
6mg
17mg
1%
Vitamin E
0.23mg
0.14mg
1%
Folate
15µg
18µg
1%
Protein per 100 calories
20g
8.3g
N/A
Calories per 10 g protein
51kcal
120kcal
N/A
Weight per 100 calories
69g
34g
N/A
Unsaturated / Saturated Fat ratio
1.4
1.2
N/A
Vitamin D*
2 IU
0%
Magnesium
25mg
23mg
0%
Sodium
80mg
72mg
0%
Manganese
0.019mg
0.022mg
0%
Tryptophan
0.254mg
0.287mg
0%
Threonine
1.25mg
1.05mg
0%
Isoleucine
1.354mg
1.183mg
0%
Leucine
2.315mg
1.908mg
0%
Lysine
2.516mg
2.166mg
0%
Methionine
0.796mg
0.629mg
0%
Phenylalanine
1.176mg
0.998mg
0%
Valine
1.407mg
1.323mg
0%
Histidine
0.716mg
0.777mg
0%
Macronutrient Comparison
Macronutrient breakdown side-by-side comparison
2
28%
3%
69%
Protein:
28.49 g
Fats:
2.57 g
Carbs:
0 g
Water:
68.51 g
Other:
0.43 g
2
25%
21%
54%
Protein:
24.52 g
Fats:
20.94 g
Carbs:
0 g
Water:
53.72 g
Other:
0.82 g
Contains
more
Protein Protein
+16.2%
Contains
more
Water Water
+27.5%
Contains
more
Fats Fats
+714.8%
Contains
more
Other Other
+90.7%
Fat Type Comparison
Fat type breakdown side-by-side comparison
1
41%
40%
18%
Saturated fat:
Sat. Fat
1 g
Monounsaturated fat:
Mono. Fat
0.97 g
Polyunsaturated fat:
Poly. Fat
0.44 g
2
46%
46%
8%
Saturated fat:
Sat. Fat
8.83 g
Monounsaturated fat:
Mono. Fat
8.82 g
Polyunsaturated fat:
Poly. Fat
1.51 g
Contains
less
Sat. Fat Saturated fat
-88.7%
Contains
more
Mono. Fat Monounsaturated fat
+809.3%
Contains
more
Poly. Fat Polyunsaturated fat
+243.2%