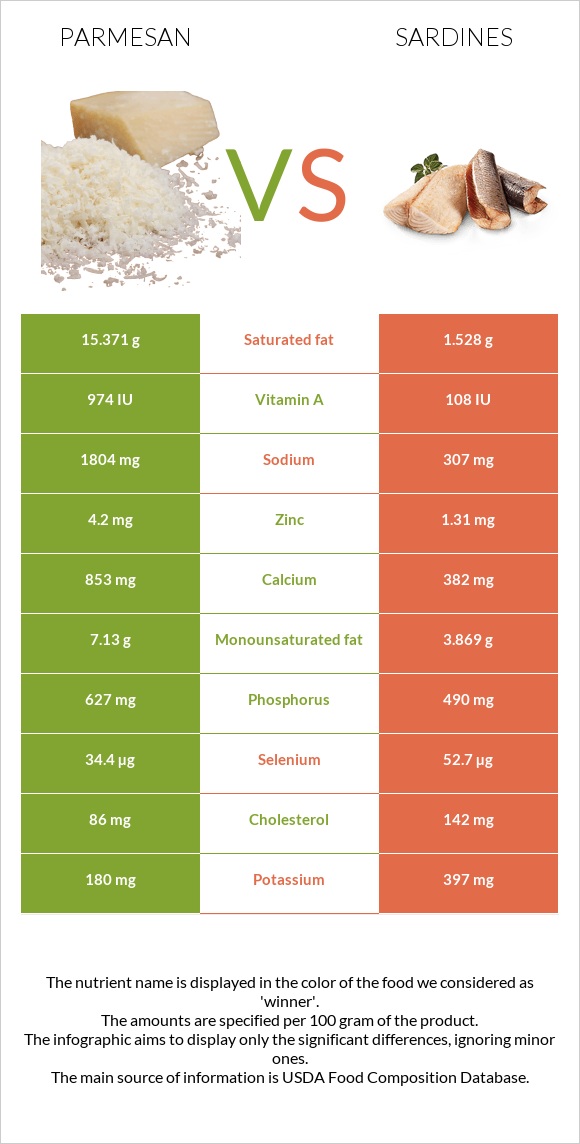
Significant differences between parmesan and sardines Parmesan has more calcium, zinc, and phosphorus; however, sardines are richer in vitamin B12, selenium, vitamin B3, iron, and vitamin D*. Sardines cover your daily vitamin B12 needs 314% more than parmesan. Sardines have 10 times less saturated fat than parmesan. Parmesan has 15.371g of saturated fat, while sardines have 1.528g. Specific food types used in this comparison are Cheese, parmesan, grated and Fish, sardine, Atlantic, canned in oil, drained solids with bone .
Infographic
Mineral Comparison
Mineral comparison score is based on the number of minerals by which one or the other food is richer. The "coverage" charts below show how much of the daily needs can be covered by 300 grams of the food.
3
100 g
300 g
1 tbsp - 5g 1 oz - 28.35g
Magnesium
Magnesium
Calcium
Calcium
Potassium
Potassium
Iron
Iron
Copper
Copper
Zinc
Zinc
Phosphorus
Phosphorus
Sodium
Sodium
Manganese
Manganese
Selenium
Selenium
24%
256%
16%
18%
13%
115%
269%
235%
9.3%
188%
7
100 g
300 g
1 small (2-2/3" x 1/2" x 1/4") - 12g 1 cubic inch - 16g 2 sardines - 24g 1 oz - 28.35g 1 can (3.75 oz) - 92g 1 cup, drained - 149g
Magnesium
Magnesium
Calcium
Calcium
Potassium
Potassium
Iron
Iron
Copper
Copper
Zinc
Zinc
Phosphorus
Phosphorus
Sodium
Sodium
Manganese
Manganese
Selenium
Selenium
28%
115%
35%
110%
62%
36%
210%
40%
14%
287%
Vitamin Comparison
Vitamin comparison score is based on the number of vitamins by which one or the other food is richer. The "coverage" charts below show how much of the daily needs can be covered by 300 grams of the food.
2
100 g
300 g
1 tbsp - 5g 1 oz - 28.35g
Vitamin C
Vit. C
Vitamin D
Vit. D
Vitamin A
Vit. A
Vitamin E
Vit. E
Vitamin B1
Vit. B1
Vitamin B2
Vit. B2
Vitamin B3
Vit. B3
Vitamin B5
Vit. B5
Vitamin B6
Vit. B6
Vitamin B12
Vit. B12
Vitamin K
Vit. K
Folate
Folate
0%
7.5%
87%
11%
6.5%
83%
1.5%
27%
19%
175%
4.3%
4.5%
9
100 g
300 g
1 small (2-2/3" x 1/2" x 1/4") - 12g 1 cubic inch - 16g 2 sardines - 24g 1 oz - 28.35g 1 can (3.75 oz) - 92g 1 cup, drained - 149g
Vitamin C
Vit. C
Vitamin D
Vit. D
Vitamin A
Vit. A
Vitamin E
Vit. E
Vitamin B1
Vit. B1
Vitamin B2
Vit. B2
Vitamin B3
Vit. B3
Vitamin B5
Vit. B5
Vitamin B6
Vit. B6
Vitamin B12
Vit. B12
Vitamin K
Vit. K
Folate
Folate
0%
72%
11%
41%
20%
52%
98%
39%
39%
1118%
6.5%
7.5%
All nutrients comparison - raw data values
Nutrient
DV% diff.
Vitamin B12
1.4µg
8.94µg
314%
Sodium
1804mg
307mg
65%
Saturated fat
15.371g
1.528g
63%
Calcium
853mg
382mg
47%
Selenium
34.4µg
52.7µg
33%
Vitamin B3
0.08mg
5.245mg
32%
Iron
0.49mg
2.92mg
30%
Zinc
4.2mg
1.31mg
26%
Vitamin A
262µg
32µg
26%
Fats
27.84g
11.45g
25%
Polyunsaturated fat
1.386g
5.148g
25%
Vitamin D*
21 IU
193 IU
22%
Vitamin D
0.5µg
4.8µg
22%
Phosphorus
627mg
490mg
20%
Cholesterol
86mg
142mg
19%
Copper
0.04mg
0.186mg
16%
Calories
420kcal
208kcal
11%
Choline
14.1mg
75mg
11%
Vitamin E
0.53mg
2.04mg
10%
Vitamin B2
0.358mg
0.227mg
10%
Protein
28.42g
24.62g
8%
Monounsaturated fat
7.13g
3.869g
8%
Vitamin B6
0.081mg
0.167mg
7%
Potassium
180mg
397mg
6%
Carbs
13.91g
0g
5%
Vitamin B1
0.026mg
0.08mg
5%
Vitamin B5
0.45mg
0.642mg
4%
Manganese
0.071mg
0.108mg
2%
Magnesium
34mg
39mg
1%
Vitamin K
1.7µg
2.6µg
1%
Folate
6µg
10µg
1%
Protein per 100 calories
6.8g
12g
N/A
Calories per 10 g protein
148kcal
84kcal
N/A
Weight per 100 calories
24g
48g
N/A
Unsaturated / Saturated Fat ratio
0.55
5.9
N/A
Net carbs
13.91g
0g
N/A
Sugar
0.07g
0g
N/A
Trans fat
0.876g
N/A
Tryptophan
0.383mg
0.276mg
0%
Threonine
1.075mg
1.079mg
0%
Isoleucine
1.455mg
1.134mg
0%
Leucine
2.747mg
2.001mg
0%
Lysine
2.201mg
2.26mg
0%
Methionine
0.751mg
0.729mg
0%
Phenylalanine
1.538mg
0.961mg
0%
Valine
1.865mg
1.268mg
0%
Histidine
0.806mg
0.725mg
0%
Omega-3 - EPA
0g
0.473g
N/A
Omega-3 - DHA
0g
0.509g
N/A
Omega-3 - ALA
0.102g
N/A
Omega-3 - DPA
0.015g
0g
N/A
Omega-3 - Eicosatrienoic acid
0.002g
N/A
Omega-6 - Gamma-linoleic acid
0.002g
N/A
Omega-6 - Dihomo-gamma-linoleic acid
0.026g
N/A
Omega-6 - Eicosadienoic acid
0.006g
N/A
Omega-6 - Linoleic acid
0.87g
N/A
Macronutrient Comparison
Macronutrient breakdown side-by-side comparison
4
28%
28%
14%
23%
7%
Protein:
28.42 g
Fats:
27.84 g
Carbs:
13.91 g
Water:
22.65 g
Other:
7.18 g
1
25%
11%
60%
4%
Protein:
24.62 g
Fats:
11.45 g
Carbs:
0 g
Water:
59.61 g
Other:
4.32 g
Contains
more
Protein Protein
+15.4%
Contains
more
Fats Fats
+143.1%
Contains
more
Carbs Carbs
+∞%
Contains
more
Other Other
+66.2%
Contains
more
Water Water
+163.2%
Fat Type Comparison
Fat type breakdown side-by-side comparison
1
64%
30%
6%
Saturated fat:
Sat. Fat
15.371 g
Monounsaturated fat:
Mono. Fat
7.13 g
Polyunsaturated fat:
Poly. Fat
1.386 g
2
14%
37%
49%
Saturated fat:
Sat. Fat
1.528 g
Monounsaturated fat:
Mono. Fat
3.869 g
Polyunsaturated fat:
Poly. Fat
5.148 g
Contains
more
Mono. Fat Monounsaturated fat
+84.3%
Contains
less
Sat. Fat Saturated fat
-90.1%
Contains
more
Poly. Fat Polyunsaturated fat
+271.4%