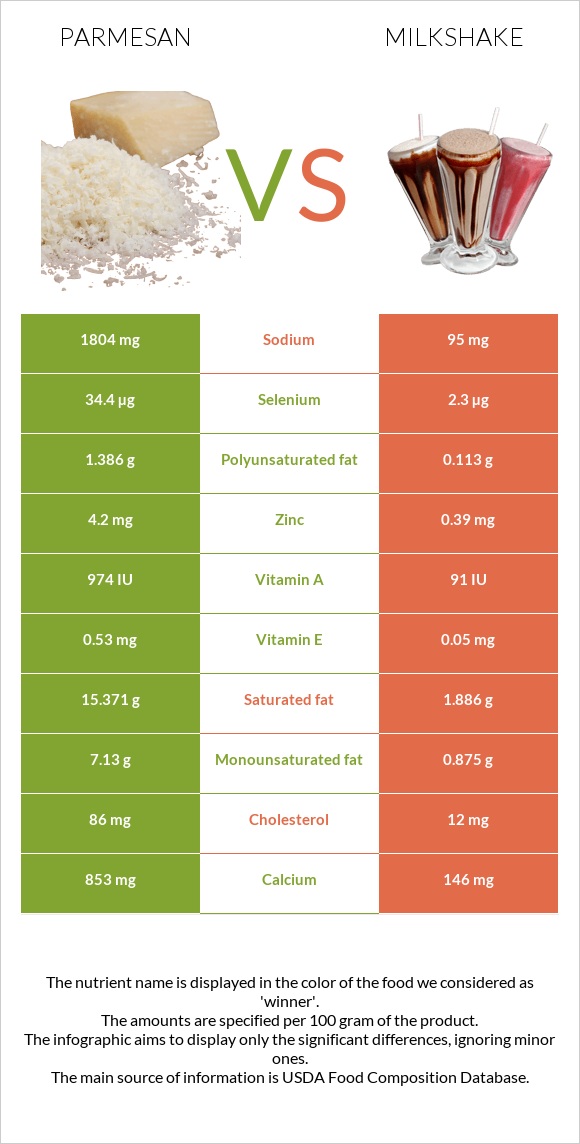
Summary of differences between parmesan and milkshake The amount of phosphorus, calcium, selenium, vitamin B12, zinc, vitamin A, and vitamin B2 in parmesan is higher than in milkshake. Parmesan covers your daily need for sodium, 74% more than milkshake. Parmesan contains 15 times more selenium than milkshake. While parmesan contains 34.4µg of selenium, milkshake contains only 2.3µg. The amount of sodium in milkshake is lower. These are the specific foods used in this comparison Cheese, parmesan, grated and Milk shakes, thick vanilla .
Infographic
Mineral Comparison
Mineral comparison score is based on the number of minerals by which one or the other food is richer. The "coverage" charts below show how much of the daily needs can be covered by 300 grams of the food.
7
100 g
300 g
1 tbsp - 5g 1 oz - 28.35g
Magnesium
Magnesium
Calcium
Calcium
Potassium
Potassium
Iron
Iron
Copper
Copper
Zinc
Zinc
Phosphorus
Phosphorus
Sodium
Sodium
Manganese
Manganese
Selenium
Selenium
24%
256%
16%
18%
13%
115%
269%
235%
9.3%
188%
2
100 g
300 g
1 fl oz - 28.4g 1 container (11 oz) - 313g
Magnesium
Magnesium
Calcium
Calcium
Potassium
Potassium
Iron
Iron
Copper
Copper
Zinc
Zinc
Phosphorus
Phosphorus
Sodium
Sodium
Manganese
Manganese
Selenium
Selenium
8.6%
44%
16%
3.8%
17%
11%
49%
12%
1.8%
13%
Vitamin Comparison
Vitamin comparison score is based on the number of vitamins by which one or the other food is richer. The "coverage" charts below show how much of the daily needs can be covered by 300 grams of the food.
7
100 g
300 g
1 tbsp - 5g 1 oz - 28.35g
Vitamin C
Vit. C
Vitamin D
Vit. D
Vitamin A
Vit. A
Vitamin E
Vit. E
Vitamin B1
Vit. B1
Vitamin B2
Vit. B2
Vitamin B3
Vit. B3
Vitamin B5
Vit. B5
Vitamin B6
Vit. B6
Vitamin B12
Vit. B12
Vitamin K
Vit. K
Folate
Folate
0%
7.5%
87%
11%
6.5%
83%
1.5%
27%
19%
175%
4.3%
4.5%
4
100 g
300 g
1 fl oz - 28.4g 1 container (11 oz) - 313g
Vitamin C
Vit. C
Vitamin D
Vit. D
Vitamin A
Vit. A
Vitamin E
Vit. E
Vitamin B1
Vit. B1
Vitamin B2
Vit. B2
Vitamin B3
Vit. B3
Vitamin B5
Vit. B5
Vitamin B6
Vit. B6
Vitamin B12
Vit. B12
Vitamin K
Vit. K
Folate
Folate
0%
18%
8.3%
1%
7.5%
45%
2.7%
22%
9.7%
65%
0.5%
5.3%
All nutrients comparison - raw data values
Nutrient
DV% diff.
Sodium
1804mg
95mg
74%
Phosphorus
627mg
115mg
73%
Calcium
853mg
146mg
71%
Saturated fat
15.371g
1.886g
61%
Selenium
34.4µg
2.3µg
58%
Protein
28.42g
3.86g
49%
Fats
27.84g
3.03g
38%
Vitamin B12
1.4µg
0.52µg
37%
Zinc
4.2mg
0.39mg
35%
Vitamin A
262µg
25µg
26%
Cholesterol
86mg
12mg
25%
Monounsaturated fat
7.13g
0.875g
16%
Calories
420kcal
112kcal
15%
Vitamin B2
0.358mg
0.195mg
13%
Polyunsaturated fat
1.386g
0.113g
8%
Magnesium
34mg
12mg
5%
Iron
0.49mg
0.1mg
5%
Vitamin D
0.5µg
1.2µg
4%
Vitamin D*
21 IU
48 IU
3%
Vitamin E
0.53mg
0.05mg
3%
Vitamin B6
0.081mg
0.042mg
3%
Manganese
0.071mg
0.014mg
2%
Vitamin B5
0.45mg
0.368mg
2%
Carbs
13.91g
17.75g
1%
Copper
0.04mg
0.051mg
1%
Vitamin K
1.7µg
0.2µg
1%
Protein per 100 calories
6.8g
3.4g
N/A
Calories per 10 g protein
148kcal
290kcal
N/A
Weight per 100 calories
24g
89g
N/A
Unsaturated / Saturated Fat ratio
0.55
0.52
N/A
Net carbs
13.91g
17.75g
N/A
Potassium
180mg
183mg
0%
Sugar
0.07g
17.75g
N/A
Vitamin B1
0.026mg
0.03mg
0%
Vitamin B3
0.08mg
0.146mg
0%
Folate
6µg
7µg
0%
Trans fat
0.876g
N/A
Choline
14.1mg
14.3mg
0%
Tryptophan
0.383mg
0.054mg
0%
Threonine
1.075mg
0.174mg
0%
Isoleucine
1.455mg
0.234mg
0%
Leucine
2.747mg
0.378mg
0%
Lysine
2.201mg
0.306mg
0%
Methionine
0.751mg
0.097mg
0%
Phenylalanine
1.538mg
0.186mg
0%
Valine
1.865mg
0.258mg
0%
Histidine
0.806mg
0.105mg
0%
Omega-3 - ALA
0.102g
N/A
Omega-3 - DPA
0.015g
0g
N/A
Omega-3 - Eicosatrienoic acid
0.002g
N/A
Omega-6 - Gamma-linoleic acid
0.002g
N/A
Omega-6 - Dihomo-gamma-linoleic acid
0.026g
N/A
Omega-6 - Eicosadienoic acid
0.006g
N/A
Omega-6 - Linoleic acid
0.87g
N/A
Macronutrient Comparison
Macronutrient breakdown side-by-side comparison
3
28%
28%
14%
23%
7%
Protein:
28.42 g
Fats:
27.84 g
Carbs:
13.91 g
Water:
22.65 g
Other:
7.18 g
2
4%
3%
18%
74%
Protein:
3.86 g
Fats:
3.03 g
Carbs:
17.75 g
Water:
74.45 g
Other:
0.91 g
Contains
more
Protein Protein
+636.3%
Contains
more
Fats Fats
+818.8%
Contains
more
Other Other
+689%
Contains
more
Carbs Carbs
+27.6%
Contains
more
Water Water
+228.7%
Fat Type Comparison
Fat type breakdown side-by-side comparison
2
64%
30%
6%
Saturated fat:
Sat. Fat
15.371 g
Monounsaturated fat:
Mono. Fat
7.13 g
Polyunsaturated fat:
Poly. Fat
1.386 g
1
66%
30%
4%
Saturated fat:
Sat. Fat
1.886 g
Monounsaturated fat:
Mono. Fat
0.875 g
Polyunsaturated fat:
Poly. Fat
0.113 g
Contains
more
Mono. Fat Monounsaturated fat
+714.9%
Contains
more
Poly. Fat Polyunsaturated fat
+1126.5%
Contains
less
Sat. Fat Saturated fat
-87.7%