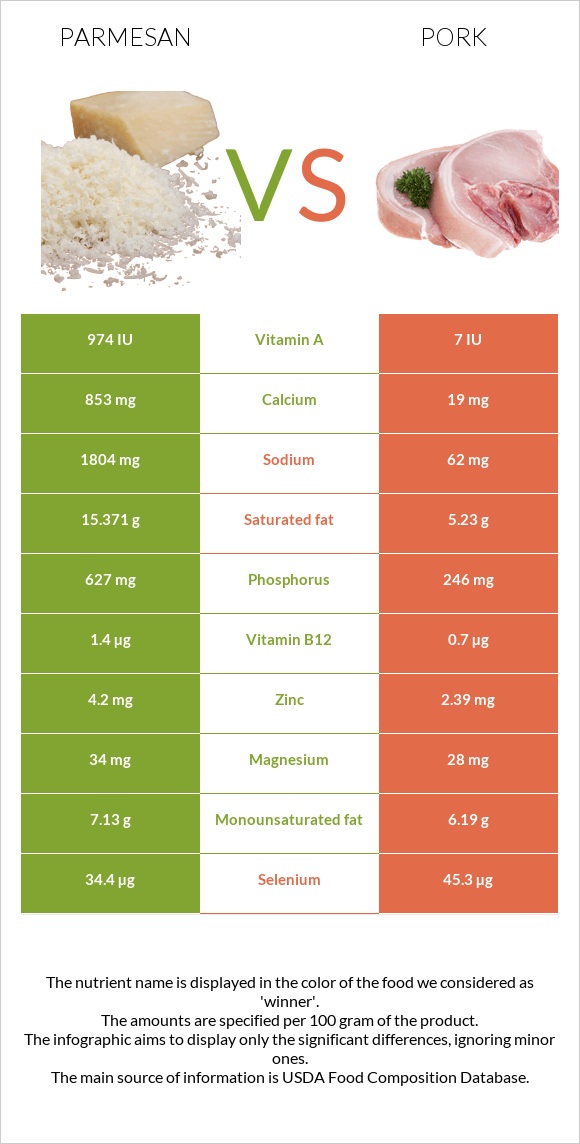
The main differences between parmesan and pork Parmesan has more calcium, phosphorus, vitamin B12, and vitamin A; however, pork has more vitamin B1, vitamin B3, vitamin B6, and selenium. Daily need coverage for calcium for parmesan is 83% higher. Pork has 139 times less vitamin A than parmesan. Parmesan has 974 IU of vitamin A, while pork has 7 IU. Pork is lower in sodium. Food types used in this article are Cheese, parmesan, grated and Pork, fresh, loin, whole, separable lean, and fat, cooked, broiled .
Infographic
Mineral Comparison
Mineral comparison score is based on the number of minerals by which one or the other food is richer. The "coverage" charts below show how much of the daily needs can be covered by 300 grams of the food.
5
100 g
300 g
1 tbsp - 5g 1 oz - 28.35g
Magnesium
Magnesium
Calcium
Calcium
Potassium
Potassium
Iron
Iron
Copper
Copper
Zinc
Zinc
Phosphorus
Phosphorus
Sodium
Sodium
Manganese
Manganese
Selenium
Selenium
24%
256%
16%
18%
13%
115%
269%
235%
9.3%
188%
5
100 g
300 g
3 oz - 85g 1 chop, excluding refuse (yield from 1 raw chop, with refuse, weighing 151 g) - 87g
Magnesium
Magnesium
Calcium
Calcium
Potassium
Potassium
Iron
Iron
Copper
Copper
Zinc
Zinc
Phosphorus
Phosphorus
Sodium
Sodium
Manganese
Manganese
Selenium
Selenium
20%
5.7%
37%
33%
24%
65%
105%
8.1%
1.2%
247%
Vitamin Comparison
Vitamin comparison score is based on the number of vitamins by which one or the other food is richer. The "coverage" charts below show how much of the daily needs can be covered by 300 grams of the food.
6
100 g
300 g
1 tbsp - 5g 1 oz - 28.35g
Vitamin C
Vit. C
Vitamin D
Vit. D
Vitamin A
Vit. A
Vitamin E
Vit. E
Vitamin B1
Vit. B1
Vitamin B2
Vit. B2
Vitamin B3
Vit. B3
Vitamin B5
Vit. B5
Vitamin B6
Vit. B6
Vitamin B12
Vit. B12
Vitamin K
Vit. K
Folate
Folate
0%
7.5%
87%
11%
6.5%
83%
1.5%
27%
19%
175%
4.3%
4.5%
6
100 g
300 g
3 oz - 85g 1 chop, excluding refuse (yield from 1 raw chop, with refuse, weighing 151 g) - 87g
Vitamin C
Vit. C
Vitamin D
Vit. D
Vitamin A
Vit. A
Vitamin E
Vit. E
Vitamin B1
Vit. B1
Vitamin B2
Vit. B2
Vitamin B3
Vit. B3
Vitamin B5
Vit. B5
Vitamin B6
Vit. B6
Vitamin B12
Vit. B12
Vitamin K
Vit. K
Folate
Folate
2%
20%
0.67%
5.8%
219%
74%
94%
42%
107%
88%
0%
3.8%
All nutrients comparison - raw data values
Nutrient
DV% diff.
Calcium
853mg
19mg
83%
Sodium
1804mg
62mg
76%
Vitamin B1
0.026mg
0.877mg
71%
Phosphorus
627mg
246mg
54%
Saturated fat
15.371g
5.23g
46%
Vitamin B3
0.08mg
5.037mg
31%
Vitamin A
262µg
2µg
29%
Vitamin B6
0.081mg
0.464mg
29%
Vitamin B12
1.4µg
0.7µg
29%
Fats
27.84g
13.92g
21%
Selenium
34.4µg
45.3µg
20%
Zinc
4.2mg
2.39mg
16%
Choline
14.1mg
93.9mg
15%
Calories
420kcal
242kcal
9%
Potassium
180mg
423mg
7%
Carbs
13.91g
0g
5%
Iron
0.49mg
0.87mg
5%
Vitamin B5
0.45mg
0.698mg
5%
Vitamin D*
21 IU
53 IU
4%
Vitamin D
0.5µg
1.3µg
4%
Copper
0.04mg
0.073mg
4%
Manganese
0.071mg
0.009mg
3%
Vitamin B2
0.358mg
0.321mg
3%
Protein
28.42g
27.32g
2%
Cholesterol
86mg
80mg
2%
Vitamin E
0.53mg
0.29mg
2%
Monounsaturated fat
7.13g
6.19g
2%
Vitamin C
0mg
0.6mg
1%
Magnesium
34mg
28mg
1%
Vitamin K
1.7µg
0µg
1%
Polyunsaturated fat
1.386g
1.2g
1%
Protein per 100 calories
6.8g
11g
N/A
Calories per 10 g protein
148kcal
89kcal
N/A
Weight per 100 calories
24g
41g
N/A
Unsaturated / Saturated Fat ratio
0.55
1.4
N/A
Net carbs
13.91g
0g
N/A
Sugar
0.07g
0g
N/A
Folate
6µg
5µg
0%
Trans fat
0.876g
N/A
Tryptophan
0.383mg
0.338mg
0%
Threonine
1.075mg
1.234mg
0%
Isoleucine
1.455mg
1.26mg
0%
Leucine
2.747mg
2.177mg
0%
Lysine
2.201mg
2.446mg
0%
Methionine
0.751mg
0.712mg
0%
Phenylalanine
1.538mg
1.086mg
0%
Valine
1.865mg
1.473mg
0%
Histidine
0.806mg
1.067mg
0%
Omega-3 - ALA
0.102g
N/A
Omega-3 - DPA
0.015g
0g
N/A
Omega-3 - Eicosatrienoic acid
0.002g
N/A
Omega-6 - Gamma-linoleic acid
0.002g
N/A
Omega-6 - Dihomo-gamma-linoleic acid
0.026g
N/A
Omega-6 - Eicosadienoic acid
0.006g
N/A
Omega-6 - Linoleic acid
0.87g
N/A
Macronutrient Comparison
Macronutrient breakdown side-by-side comparison
4
28%
28%
14%
23%
7%
Protein:
28.42 g
Fats:
27.84 g
Carbs:
13.91 g
Water:
22.65 g
Other:
7.18 g
1
27%
14%
58%
Protein:
27.32 g
Fats:
13.92 g
Carbs:
0 g
Water:
57.87 g
Other:
0.89 g
Contains
more
Fats Fats
+100%
Contains
more
Carbs Carbs
+∞%
Contains
more
Other Other
+706.7%
Contains
more
Water Water
+155.5%
~equal in
Protein
~27.32g
Fat Type Comparison
Fat type breakdown side-by-side comparison
2
64%
30%
6%
Saturated fat:
Sat. Fat
15.371 g
Monounsaturated fat:
Mono. Fat
7.13 g
Polyunsaturated fat:
Poly. Fat
1.386 g
1
41%
49%
10%
Saturated fat:
Sat. Fat
5.23 g
Monounsaturated fat:
Mono. Fat
6.19 g
Polyunsaturated fat:
Poly. Fat
1.2 g
Contains
more
Mono. Fat Monounsaturated fat
+15.2%
Contains
more
Poly. Fat Polyunsaturated fat
+15.5%
Contains
less
Sat. Fat Saturated fat
-66%