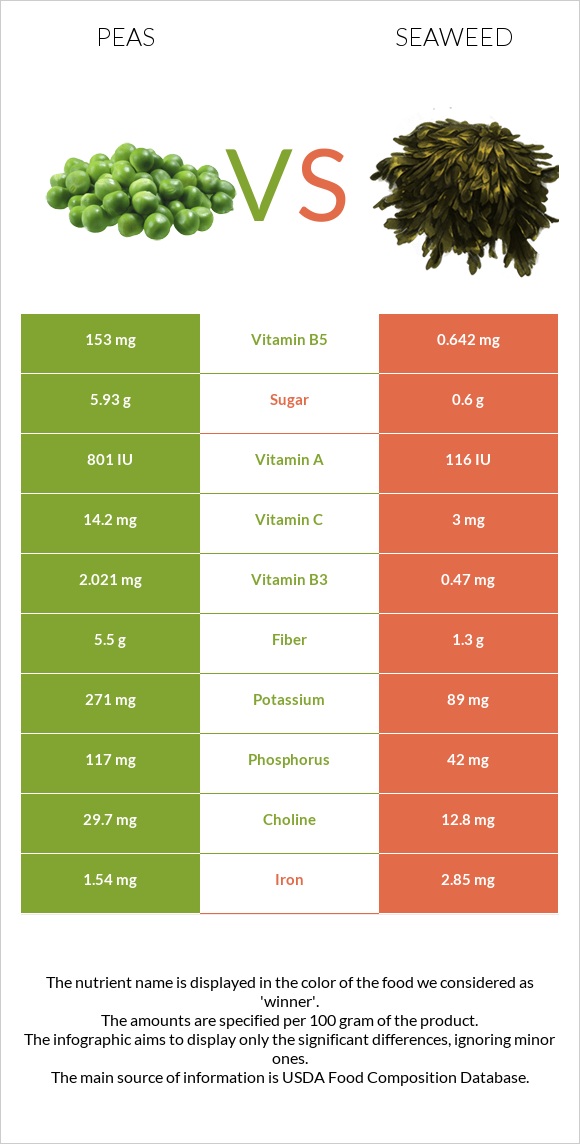
Significant differences between peas and seaweed Peas have more vitamin B5, vitamin B1, fiber, vitamin B6, and manganese; however, seaweed is richer in vitamin K, folate, magnesium, iron, and calcium. Peas cover your daily vitamin B5 needs 3047% more than seaweed. Seaweed has 108 times less vitamin B6 than peas. Peas have 0.216mg of vitamin B6, while seaweed has 0.002mg. Specific food types used in this comparison are Peas, green, cooked, boiled, drained, without salt and Seaweed, kelp, raw .
Infographic
Mineral Comparison
Mineral comparison score is based on the number of minerals by which one or the other food is richer. The "coverage" charts below show how much of the daily needs can be covered by 300 grams of the food.
6
100 g
300 g
1 cup - 160g
Magnesium
Magnesium
Calcium
Calcium
Potassium
Potassium
Iron
Iron
Copper
Copper
Zinc
Zinc
Phosphorus
Phosphorus
Sodium
Sodium
Manganese
Manganese
Selenium
Selenium
28%
8.1%
24%
58%
58%
32%
50%
0.39%
68%
10%
3
100 g
300 g
2 tbsp (1/8 cup) - 10g
Magnesium
Magnesium
Calcium
Calcium
Potassium
Potassium
Iron
Iron
Copper
Copper
Zinc
Zinc
Phosphorus
Phosphorus
Sodium
Sodium
Manganese
Manganese
Selenium
Selenium
86%
50%
7.9%
107%
43%
34%
18%
30%
26%
3.8%
Vitamin Comparison
Vitamin comparison score is based on the number of vitamins by which one or the other food is richer. The "coverage" charts below show how much of the daily needs can be covered by 300 grams of the food.
6
100 g
300 g
1 cup - 160g
Vitamin C
Vit. C
Vitamin D
Vit. D
Vitamin A
Vit. A
Vitamin E
Vit. E
Vitamin B1
Vit. B1
Vitamin B2
Vit. B2
Vitamin B3
Vit. B3
Vitamin B5
Vit. B5
Vitamin B6
Vit. B6
Vitamin B12
Vit. B12
Vitamin K
Vit. K
Folate
Folate
47%
0%
13%
2.8%
65%
34%
38%
9180%
50%
0%
65%
47%
3
100 g
300 g
2 tbsp (1/8 cup) - 10g
Vitamin C
Vit. C
Vitamin D
Vit. D
Vitamin A
Vit. A
Vitamin E
Vit. E
Vitamin B1
Vit. B1
Vitamin B2
Vit. B2
Vitamin B3
Vit. B3
Vitamin B5
Vit. B5
Vitamin B6
Vit. B6
Vitamin B12
Vit. B12
Vitamin K
Vit. K
Folate
Folate
10%
0%
2%
17%
13%
35%
8.8%
39%
0.46%
0%
165%
135%
All nutrients comparison - raw data values
Nutrient
DV% diff.
Vitamin B5
153mg
0.642mg
3047%
Vitamin K
25.9µg
66µg
33%
Folate
63µg
180µg
29%
Magnesium
39mg
121mg
20%
Fiber
5.5g
1.3g
17%
Vitamin B1
0.259mg
0.05mg
17%
Iron
1.54mg
2.85mg
16%
Vitamin B6
0.216mg
0.002mg
16%
Calcium
27mg
168mg
14%
Manganese
0.525mg
0.2mg
14%
Vitamin C
14.2mg
3mg
12%
Phosphorus
117mg
42mg
11%
Sodium
3mg
233mg
10%
Vitamin B3
2.021mg
0.47mg
10%
Protein
5.36g
1.68g
7%
Potassium
271mg
89mg
5%
Copper
0.173mg
0.13mg
5%
Vitamin E
0.14mg
0.87mg
5%
Vitamin A
40µg
6µg
4%
Choline
29.7mg
12.8mg
3%
Calories
84kcal
43kcal
2%
Carbs
15.63g
9.57g
2%
Selenium
1.9µg
0.7µg
2%
Fats
0.22g
0.56g
1%
Saturated fat
0.039g
0.247g
1%
Fructose
0.41g
1%
Protein per 100 calories
6.4g
3.9g
N/A
Calories per 10 g protein
157kcal
256kcal
N/A
Weight per 100 calories
119g
233g
N/A
Net carbs
10.13g
8.27g
N/A
Sugar
5.93g
0.6g
N/A
Zinc
1.19mg
1.23mg
0%
Vitamin B2
0.149mg
0.15mg
0%
Monounsaturated fat
0.019g
0.098g
0%
Polyunsaturated fat
0.102g
0.047g
0%
Tryptophan
0.037mg
0.048mg
0%
Threonine
0.201mg
0.055mg
0%
Isoleucine
0.193mg
0.076mg
0%
Leucine
0.32mg
0.083mg
0%
Lysine
0.314mg
0.082mg
0%
Methionine
0.081mg
0.025mg
0%
Phenylalanine
0.198mg
0.043mg
0%
Valine
0.232mg
0.072mg
0%
Histidine
0.105mg
0.024mg
0%
Omega-3 - EPA
0g
0.004g
N/A
Macronutrient Comparison
Macronutrient breakdown side-by-side comparison
2
5%
16%
78%
Protein:
5.36 g
Fats:
0.22 g
Carbs:
15.63 g
Water:
77.87 g
Other:
0.92 g
3
2%
10%
82%
7%
Protein:
1.68 g
Fats:
0.56 g
Carbs:
9.57 g
Water:
81.58 g
Other:
6.61 g
Contains
more
Protein Protein
+219%
Contains
more
Carbs Carbs
+63.3%
Contains
more
Fats Fats
+154.5%
Contains
more
Other Other
+618.5%
Fat Type Comparison
Fat type breakdown side-by-side comparison
2
24%
12%
64%
Saturated fat:
Sat. Fat
0.039 g
Monounsaturated fat:
Mono. Fat
0.019 g
Polyunsaturated fat:
Poly. Fat
0.102 g
1
63%
25%
12%
Saturated fat:
Sat. Fat
0.247 g
Monounsaturated fat:
Mono. Fat
0.098 g
Polyunsaturated fat:
Poly. Fat
0.047 g
Contains
less
Sat. Fat Saturated fat
-84.2%
Contains
more
Poly. Fat Polyunsaturated fat
+117%
Contains
more
Mono. Fat Monounsaturated fat
+415.8%