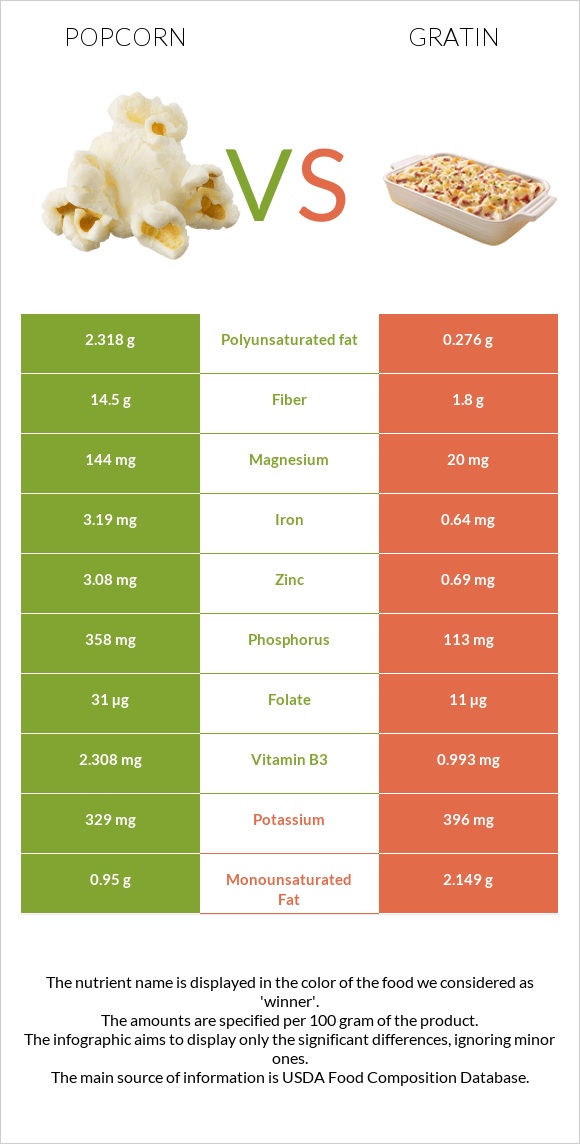
What are the differences between popcorn and gratin? Popcorn is higher in fiber, manganese, phosphorus, iron, magnesium, zinc, and copper, yet gratin is higher in calcium. Popcorn's daily need coverage for fiber is 51% more. Popcorn has 7 times more magnesium than gratin. While popcorn has 144mg of magnesium, gratin has only 20mg. The amount of saturated fat in popcorn is lower. We used Snacks, popcorn, air-popped and Potatoes, au gratin, home-prepared from recipe using butter types in this article.
Infographic
Mineral Comparison
Mineral comparison score is based on the number of minerals by which one or the other food is richer. The "coverage" charts below show how much of the daily needs can be covered by 300 grams of the food.
7
100 g
300 g
1 cup - 8g 1 oz - 28.35g
Magnesium
Magnesium
Calcium
Calcium
Potassium
Potassium
Iron
Iron
Copper
Copper
Zinc
Zinc
Phosphorus
Phosphorus
Sodium
Sodium
Manganese
Manganese
Selenium
Selenium
103%
2.1%
29%
120%
87%
84%
153%
1%
145%
0%
3
100 g
300 g
1 cup - 245g
Magnesium
Magnesium
Calcium
Calcium
Potassium
Potassium
Iron
Iron
Copper
Copper
Zinc
Zinc
Phosphorus
Phosphorus
Sodium
Sodium
Manganese
Manganese
Selenium
Selenium
14%
36%
35%
24%
53%
19%
48%
56%
21%
15%
Vitamin Comparison
Vitamin comparison score is based on the number of vitamins by which one or the other food is richer. The "coverage" charts below show how much of the daily needs can be covered by 300 grams of the food.
6
100 g
300 g
1 cup - 8g 1 oz - 28.35g
Vitamin C
Vit. C
Vitamin D
Vit. D
Vitamin A
Vit. A
Vitamin E
Vit. E
Vitamin B1
Vit. B1
Vitamin B2
Vit. B2
Vitamin B3
Vit. B3
Vitamin B5
Vit. B5
Vitamin B6
Vit. B6
Vitamin B12
Vit. B12
Vitamin K
Vit. K
Folate
Folate
0%
0%
3.3%
5.8%
26%
19%
43%
31%
36%
0%
3%
23%
4
100 g
300 g
1 cup - 245g
Vitamin C
Vit. C
Vitamin D
Vit. D
Vitamin A
Vit. A
Vitamin E
Vit. E
Vitamin B1
Vit. B1
Vitamin B2
Vit. B2
Vitamin B3
Vit. B3
Vitamin B5
Vit. B5
Vitamin B6
Vit. B6
Vitamin B12
Vit. B12
Vitamin K
Vit. K
Folate
Folate
33%
0%
21%
0%
16%
27%
19%
23%
40%
0%
0%
8.3%
All nutrients comparison - raw data values
Nutrient
DV% diff.
Fiber
14.5g
1.8g
51%
Manganese
1.113mg
0.161mg
41%
Phosphorus
358mg
113mg
35%
Iron
3.19mg
0.64mg
32%
Magnesium
144mg
20mg
30%
Carbs
77.78g
11.27g
22%
Zinc
3.08mg
0.69mg
22%
Starch
54.4g
22%
Saturated fat
0.637g
4.733g
19%
Sodium
8mg
433mg
18%
Protein
12.94g
5.06g
16%
Polyunsaturated fat
2.318g
0.276g
14%
Calories
387kcal
132kcal
13%
Vitamin C
0mg
9.9mg
11%
Calcium
7mg
119mg
11%
Copper
0.262mg
0.16mg
11%
Cholesterol
0mg
23mg
8%
Vitamin B3
2.308mg
0.993mg
8%
Vitamin A
10µg
64µg
6%
Fats
4.54g
7.59g
5%
Selenium
0µg
2.7µg
5%
Folate
31µg
11µg
5%
Choline
21.2mg
4%
Vitamin B1
0.104mg
0.064mg
3%
Vitamin B2
0.083mg
0.116mg
3%
Monounsaturated fat
0.95g
2.149g
3%
Potassium
329mg
396mg
2%
Vitamin E
0.29mg
2%
Vitamin B5
0.51mg
0.387mg
2%
Vitamin B6
0.157mg
0.174mg
1%
Vitamin K
1.2µg
1%
Protein per 100 calories
3.3g
3.8g
N/A
Calories per 10 g protein
299kcal
261kcal
N/A
Weight per 100 calories
26g
76g
N/A
Unsaturated / Saturated Fat ratio
5.1
0.51
N/A
Net carbs
63.28g
9.47g
N/A
Sugar
0.87g
N/A
Tryptophan
0.085mg
0.07mg
0%
Threonine
0.452mg
0.192mg
0%
Isoleucine
0.431mg
0.284mg
0%
Leucine
1.473mg
0.443mg
0%
Lysine
0.338mg
0.381mg
0%
Methionine
0.252mg
0.117mg
0%
Phenylalanine
0.59mg
0.254mg
0%
Valine
0.607mg
0.325mg
0%
Histidine
0.367mg
0.151mg
0%
Fructose
0.07g
0%
Macronutrient Comparison
Macronutrient breakdown side-by-side comparison
2
13%
5%
78%
3%
Protein:
12.94 g
Fats:
4.54 g
Carbs:
77.78 g
Water:
3.32 g
Other:
1.42 g
3
5%
8%
11%
74%
2%
Protein:
5.06 g
Fats:
7.59 g
Carbs:
11.27 g
Water:
74 g
Other:
2.08 g
Contains
more
Protein Protein
+155.7%
Contains
more
Carbs Carbs
+590.2%
Contains
more
Fats Fats
+67.2%
Contains
more
Water Water
+2128.9%
Contains
more
Other Other
+46.5%
Fat Type Comparison
Fat type breakdown side-by-side comparison
2
16%
24%
59%
Saturated fat:
Sat. Fat
0.637 g
Monounsaturated fat:
Mono. Fat
0.95 g
Polyunsaturated fat:
Poly. Fat
2.318 g
1
66%
30%
4%
Saturated fat:
Sat. Fat
4.733 g
Monounsaturated fat:
Mono. Fat
2.149 g
Polyunsaturated fat:
Poly. Fat
0.276 g
Contains
less
Sat. Fat Saturated fat
-86.5%
Contains
more
Poly. Fat Polyunsaturated fat
+739.9%
Contains
more
Mono. Fat Monounsaturated fat
+126.2%