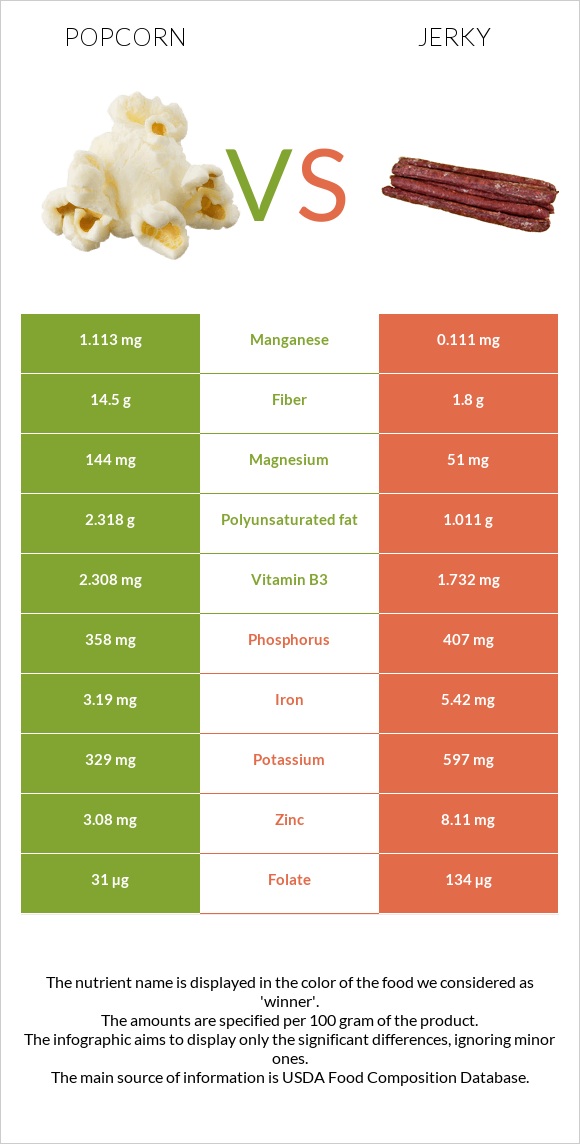
What are the main differences between popcorn and jerky? Popcorn is richer in fiber, manganese, and magnesium, yet jerky is richer in zinc, vitamin B12, iron, folate, and selenium. Jerky's daily need coverage for sodium is 90% higher. Popcorn has 10 times more manganese than jerky. Popcorn has 1.113mg of manganese, while jerky has 0.111mg. Popcorn contains less saturated fat. Jerky has a lower glycemic index than popcorn. We used Snacks, popcorn, air-popped and Snacks, beef jerky, chopped, and formed types in this comparison.
Infographic
Mineral Comparison
Mineral comparison score is based on the number of minerals by which one or the other food is richer. The "coverage" charts below show how much of the daily needs can be covered by 300 grams of the food.
4
100 g
300 g
1 cup - 8g 1 oz - 28.35g
Magnesium
Magnesium
Calcium
Calcium
Potassium
Potassium
Iron
Iron
Copper
Copper
Zinc
Zinc
Phosphorus
Phosphorus
Sodium
Sodium
Manganese
Manganese
Selenium
Selenium
103%
2.1%
29%
120%
87%
84%
153%
1%
145%
0%
6
100 g
300 g
1 piece, large - 20g 1 oz - 28.35g 1 oz - 28.35g
Magnesium
Magnesium
Calcium
Calcium
Potassium
Potassium
Iron
Iron
Copper
Copper
Zinc
Zinc
Phosphorus
Phosphorus
Sodium
Sodium
Manganese
Manganese
Selenium
Selenium
36%
6%
53%
203%
76%
221%
174%
271%
14%
58%
Vitamin Comparison
Vitamin comparison score is based on the number of vitamins by which one or the other food is richer. The "coverage" charts below show how much of the daily needs can be covered by 300 grams of the food.
3
100 g
300 g
1 cup - 8g 1 oz - 28.35g
Vitamin C
Vit. C
Vitamin D
Vit. D
Vitamin A
Vit. A
Vitamin E
Vit. E
Vitamin B1
Vit. B1
Vitamin B2
Vit. B2
Vitamin B3
Vit. B3
Vitamin B5
Vit. B5
Vitamin B6
Vit. B6
Vitamin B12
Vit. B12
Vitamin K
Vit. K
Folate
Folate
0%
0%
3.3%
5.8%
26%
19%
43%
31%
36%
0%
3%
23%
8
100 g
300 g
1 piece, large - 20g 1 oz - 28.35g 1 oz - 28.35g
Vitamin C
Vit. C
Vitamin D
Vit. D
Vitamin A
Vit. A
Vitamin E
Vit. E
Vitamin B1
Vit. B1
Vitamin B2
Vit. B2
Vitamin B3
Vit. B3
Vitamin B5
Vit. B5
Vitamin B6
Vit. B6
Vitamin B12
Vit. B12
Vitamin K
Vit. K
Folate
Folate
0%
4.5%
0%
9.8%
39%
33%
32%
9.8%
41%
124%
5.8%
101%
All nutrients comparison - raw data values
Nutrient
DV% diff.
Sodium
8mg
2081mg
90%
Fiber
14.5g
1.8g
51%
Zinc
3.08mg
8.11mg
46%
Saturated fat
0.637g
10.85g
46%
Manganese
1.113mg
0.111mg
44%
Protein
12.94g
33.2g
41%
Vitamin B12
0µg
0.99µg
41%
Fats
4.54g
25.6g
32%
Iron
3.19mg
5.42mg
28%
Folate
31µg
134µg
26%
Monounsaturated fat
0.95g
11.305g
26%
Carbs
77.78g
11g
22%
Magnesium
144mg
51mg
22%
Starch
54.4g
22%
Selenium
0µg
10.7µg
19%
Cholesterol
0mg
48mg
16%
Choline
21.2mg
109.1mg
16%
Polyunsaturated fat
2.318g
1.011g
9%
Potassium
329mg
597mg
8%
Phosphorus
358mg
407mg
7%
Vitamin B5
0.51mg
0.163mg
7%
Vitamin B2
0.083mg
0.142mg
5%
Copper
0.262mg
0.227mg
4%
Vitamin B1
0.104mg
0.154mg
4%
Vitamin B3
2.308mg
1.732mg
4%
Vitamin D
0µg
0.3µg
2%
Vitamin B6
0.157mg
0.179mg
2%
Calories
387kcal
410kcal
1%
Vitamin D*
0 IU
11 IU
1%
Calcium
7mg
20mg
1%
Vitamin A
10µg
0µg
1%
Vitamin E
0.29mg
0.49mg
1%
Vitamin K
1.2µg
2.3µg
1%
Protein per 100 calories
3.3g
8.1g
N/A
Calories per 10 g protein
299kcal
123kcal
N/A
Weight per 100 calories
26g
24g
N/A
Unsaturated / Saturated Fat ratio
5.1
1.1
N/A
Net carbs
63.28g
9.2g
N/A
Sugar
0.87g
9g
N/A
Tryptophan
0.085mg
0%
Threonine
0.452mg
0%
Isoleucine
0.431mg
0%
Leucine
1.473mg
0%
Lysine
0.338mg
0%
Methionine
0.252mg
0%
Phenylalanine
0.59mg
0%
Valine
0.607mg
0%
Histidine
0.367mg
0%
Fructose
0.07g
0%
Macronutrient Comparison
Macronutrient breakdown side-by-side comparison
1
13%
5%
78%
3%
Protein:
12.94 g
Fats:
4.54 g
Carbs:
77.78 g
Water:
3.32 g
Other:
1.42 g
4
33%
26%
11%
23%
7%
Protein:
33.2 g
Fats:
25.6 g
Carbs:
11 g
Water:
23.36 g
Other:
6.84 g
Contains
more
Carbs Carbs
+607.1%
Contains
more
Protein Protein
+156.6%
Contains
more
Fats Fats
+463.9%
Contains
more
Water Water
+603.6%
Contains
more
Other Other
+381.7%
Fat Type Comparison
Fat type breakdown side-by-side comparison
2
16%
24%
59%
Saturated fat:
Sat. Fat
0.637 g
Monounsaturated fat:
Mono. Fat
0.95 g
Polyunsaturated fat:
Poly. Fat
2.318 g
1
47%
49%
4%
Saturated fat:
Sat. Fat
10.85 g
Monounsaturated fat:
Mono. Fat
11.305 g
Polyunsaturated fat:
Poly. Fat
1.011 g
Contains
less
Sat. Fat Saturated fat
-94.1%
Contains
more
Poly. Fat Polyunsaturated fat
+129.3%
Contains
more
Mono. Fat Monounsaturated fat
+1090%