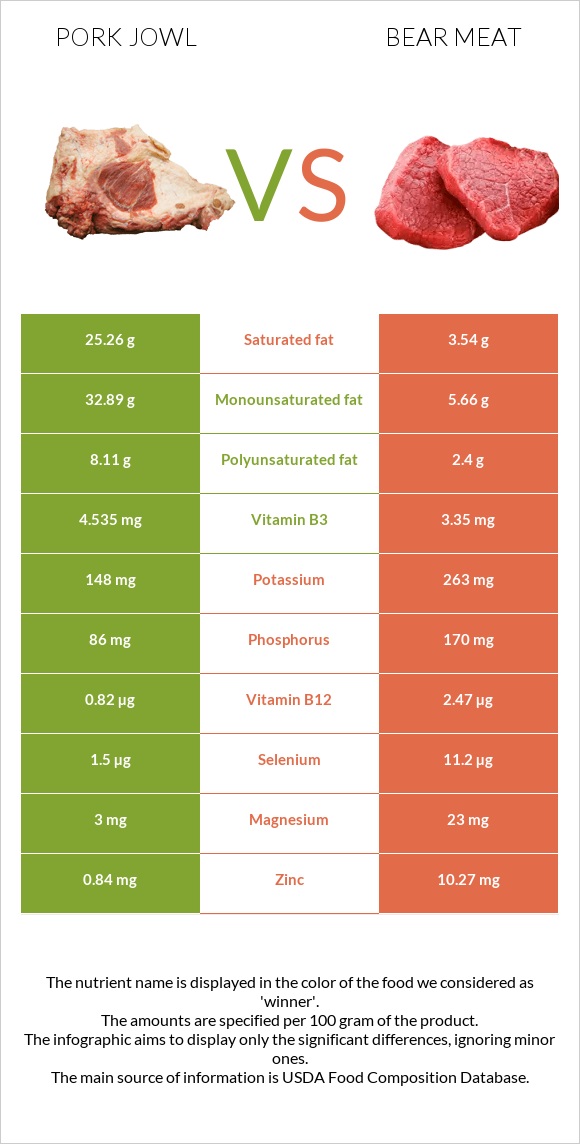
Important differences between pork jowl and bear meat Pork jowl has more vitamin B1; however, bear meat has more iron, zinc, vitamin B12, vitamin B2, selenium, vitamin B6, phosphorus, and copper. Bear meat's daily need coverage for iron is 129% more. Pork jowl has 7 times more saturated fat than bear meat. Pork jowl has 25.26g of saturated fat, while bear meat has 3.54g. The food varieties used in the comparison are Pork, fresh, variety meats, and by-products, jowl, raw and Game meat, bear, cooked, simmered .
Infographic
Mineral Comparison
Mineral comparison score is based on the number of minerals by which one or the other food is richer. The "coverage" charts below show how much of the daily needs can be covered by 300 grams of the food.
2
100 g
300 g
1 oz - 28.35g 4 oz - 113g
Magnesium
Magnesium
Calcium
Calcium
Potassium
Potassium
Iron
Iron
Copper
Copper
Zinc
Zinc
Phosphorus
Phosphorus
Sodium
Sodium
Manganese
Manganese
Selenium
Selenium
2.1%
1.2%
13%
16%
13%
23%
37%
3.3%
0.65%
8.2%
8
100 g
300 g
3 oz - 85g 1 piece, cooked (yield from 1 lb raw meat, boneless) - 277g
Magnesium
Magnesium
Calcium
Calcium
Potassium
Potassium
Iron
Iron
Copper
Copper
Zinc
Zinc
Phosphorus
Phosphorus
Sodium
Sodium
Manganese
Manganese
Selenium
Selenium
16%
1.5%
23%
402%
49%
280%
73%
9.3%
0%
61%
Vitamin Comparison
Vitamin comparison score is based on the number of vitamins by which one or the other food is richer. The "coverage" charts below show how much of the daily needs can be covered by 300 grams of the food.
4
100 g
300 g
1 oz - 28.35g 4 oz - 113g
Vitamin C
Vit. C
Vitamin D
Vit. D
Vitamin A
Vit. A
Vitamin E
Vit. E
Vitamin B1
Vit. B1
Vitamin B2
Vit. B2
Vitamin B3
Vit. B3
Vitamin B5
Vit. B5
Vitamin B6
Vit. B6
Vitamin B12
Vit. B12
Vitamin K
Vit. K
Folate
Folate
0%
0%
1%
5.8%
97%
54%
85%
15%
21%
103%
0%
0.75%
6
100 g
300 g
3 oz - 85g 1 piece, cooked (yield from 1 lb raw meat, boneless) - 277g
Vitamin C
Vit. C
Vitamin D
Vit. D
Vitamin A
Vit. A
Vitamin E
Vit. E
Vitamin B1
Vit. B1
Vitamin B2
Vit. B2
Vitamin B3
Vit. B3
Vitamin B5
Vit. B5
Vitamin B6
Vit. B6
Vitamin B12
Vit. B12
Vitamin K
Vit. K
Folate
Folate
0%
0%
0%
9.8%
25%
189%
63%
0%
67%
309%
4.5%
4.5%
All nutrients comparison - raw data values
Nutrient
DV% diff.
Iron
0.42mg
10.73mg
129%
Saturated fat
25.26g
3.54g
99%
Fats
69.61g
13.39g
86%
Zinc
0.84mg
10.27mg
86%
Vitamin B12
0.82µg
2.47µg
69%
Monounsaturated fat
32.89g
5.66g
68%
Protein
6.38g
32.42g
52%
Vitamin B2
0.236mg
0.82mg
45%
Polyunsaturated fat
8.11g
2.4g
38%
Vitamin B1
0.386mg
0.1mg
24%
Choline
122.3mg
22%
Calories
655kcal
259kcal
20%
Selenium
1.5µg
11.2µg
18%
Vitamin B6
0.09mg
0.29mg
15%
Copper
0.04mg
0.148mg
12%
Phosphorus
86mg
170mg
12%
Vitamin B3
4.535mg
3.35mg
7%
Magnesium
3mg
23mg
5%
Vitamin B5
0.25mg
5%
Cholesterol
90mg
98mg
3%
Potassium
148mg
263mg
3%
Sodium
25mg
71mg
2%
Vitamin K
1.8µg
2%
Vitamin E
0.29mg
0.49mg
1%
Folate
1µg
6µg
1%
Protein per 100 calories
0.97g
13g
N/A
Calories per 10 g protein
1027kcal
80kcal
N/A
Weight per 100 calories
15g
39g
N/A
Unsaturated / Saturated Fat ratio
1.6
2.3
N/A
Calcium
4mg
5mg
0%
Vitamin A
3µg
0µg
0%
Manganese
0.005mg
0%
Tryptophan
0.021mg
0%
Threonine
0.21mg
0%
Isoleucine
0.168mg
0%
Leucine
0.446mg
0%
Lysine
0.528mg
0%
Methionine
0.095mg
0%
Phenylalanine
0.239mg
0%
Valine
0.305mg
0%
Histidine
0.072mg
0%
Omega-3 - DHA
0g
0.037g
N/A
Omega-3 - DPA
0g
0.034g
N/A
Macronutrient Comparison
Macronutrient breakdown side-by-side comparison
2
6%
70%
22%
2%
Protein:
6.38 g
Fats:
69.61 g
Carbs:
0 g
Water:
22.19 g
Other:
1.82 g
2
32%
13%
54%
Protein:
32.42 g
Fats:
13.39 g
Carbs:
0 g
Water:
53.55 g
Other:
0.64 g
Contains
more
Fats Fats
+419.9%
Contains
more
Other Other
+184.4%
Contains
more
Protein Protein
+408.2%
Contains
more
Water Water
+141.3%
Fat Type Comparison
Fat type breakdown side-by-side comparison
2
38%
50%
12%
Saturated fat:
Sat. Fat
25.26 g
Monounsaturated fat:
Mono. Fat
32.89 g
Polyunsaturated fat:
Poly. Fat
8.11 g
1
31%
49%
21%
Saturated fat:
Sat. Fat
3.54 g
Monounsaturated fat:
Mono. Fat
5.66 g
Polyunsaturated fat:
Poly. Fat
2.4 g
Contains
more
Mono. Fat Monounsaturated fat
+481.1%
Contains
more
Poly. Fat Polyunsaturated fat
+237.9%
Contains
less
Sat. Fat Saturated fat
-86%