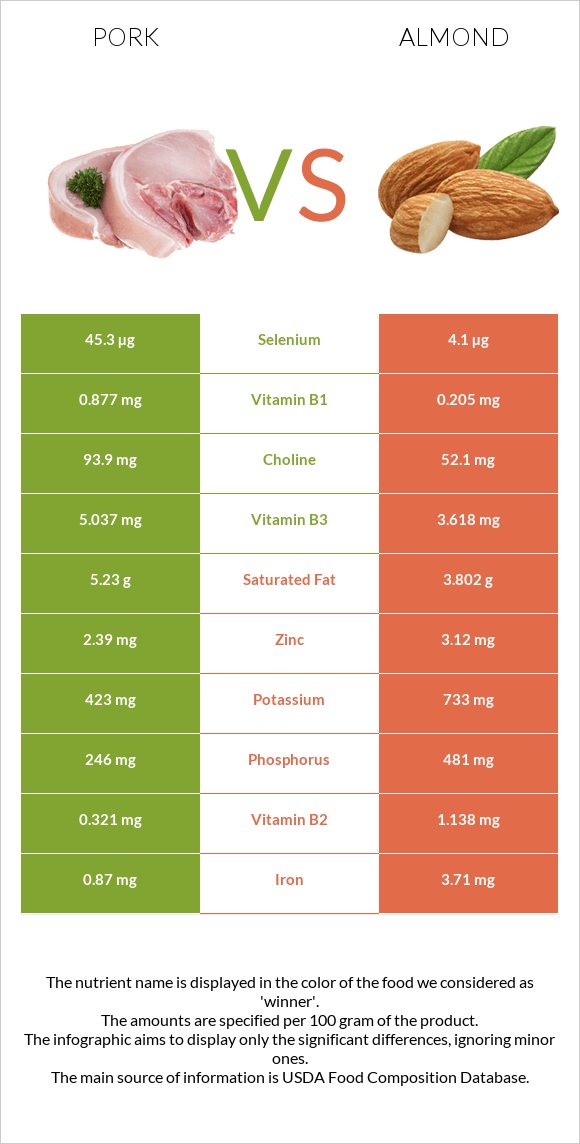
Summary of differences between pork and almonds Pork has more selenium and vitamin B1, while almonds have more vitamin E, copper, manganese, vitamin B2, magnesium, fiber, iron, and phosphorus. Almonds cover your daily need for vitamin E, 169% more than pork. Pork contains 11 times more selenium than almonds. While pork contains 45.3µg of selenium, almonds contain only 4.1µg. These are the specific foods used in this comparison Pork, fresh, loin, whole, separable lean, and fat, cooked, broiled and Nuts, almonds .
Infographic
Mineral Comparison
Mineral comparison score is based on the number of minerals by which one or the other food is richer. The "coverage" charts below show how much of the daily needs can be covered by 300 grams of the food.
1
100 g
300 g
3 oz - 85g 1 chop, excluding refuse (yield from 1 raw chop, with refuse, weighing 151 g) - 87g
Magnesium
Magnesium
Calcium
Calcium
Potassium
Potassium
Iron
Iron
Copper
Copper
Zinc
Zinc
Phosphorus
Phosphorus
Sodium
Sodium
Manganese
Manganese
Selenium
Selenium
20%
5.7%
37%
33%
24%
65%
105%
8.1%
1.2%
247%
9
100 g
300 g
1 almond - 1.2g 1 oz (23 whole kernels) - 28.35g 1 cup, sliced - 92g 1 cup, ground - 95g 1 cup, slivered - 108g 1 cup, whole - 143g
Magnesium
Magnesium
Calcium
Calcium
Potassium
Potassium
Iron
Iron
Copper
Copper
Zinc
Zinc
Phosphorus
Phosphorus
Sodium
Sodium
Manganese
Manganese
Selenium
Selenium
193%
81%
65%
139%
344%
85%
206%
0.13%
284%
22%
Vitamin Comparison
Vitamin comparison score is based on the number of vitamins by which one or the other food is richer. The "coverage" charts below show how much of the daily needs can be covered by 300 grams of the food.
8
100 g
300 g
3 oz - 85g 1 chop, excluding refuse (yield from 1 raw chop, with refuse, weighing 151 g) - 87g
Vitamin C
Vit. C
Vitamin D
Vit. D
Vitamin A
Vit. A
Vitamin E
Vit. E
Vitamin B1
Vit. B1
Vitamin B2
Vit. B2
Vitamin B3
Vit. B3
Vitamin B5
Vit. B5
Vitamin B6
Vit. B6
Vitamin B12
Vit. B12
Vitamin K
Vit. K
Folate
Folate
2%
20%
0.67%
5.8%
219%
74%
94%
42%
107%
88%
0%
3.8%
3
100 g
300 g
1 almond - 1.2g 1 oz (23 whole kernels) - 28.35g 1 cup, sliced - 92g 1 cup, ground - 95g 1 cup, slivered - 108g 1 cup, whole - 143g
Vitamin C
Vit. C
Vitamin D
Vit. D
Vitamin A
Vit. A
Vitamin E
Vit. E
Vitamin B1
Vit. B1
Vitamin B2
Vit. B2
Vitamin B3
Vit. B3
Vitamin B5
Vit. B5
Vitamin B6
Vit. B6
Vitamin B12
Vit. B12
Vitamin K
Vit. K
Folate
Folate
0%
0%
0%
513%
51%
263%
68%
28%
32%
0%
0%
33%
All nutrients comparison - raw data values
Nutrient
DV% diff.
Vitamin E
0.29mg
25.63mg
169%
Copper
0.073mg
1.031mg
106%
Manganese
0.009mg
2.179mg
94%
Selenium
45.3µg
4.1µg
75%
Polyunsaturated fat
1.2g
12.329g
74%
Vitamin B2
0.321mg
1.138mg
63%
Monounsaturated fat
6.19g
31.551g
63%
Magnesium
28mg
270mg
58%
Vitamin B1
0.877mg
0.205mg
56%
Fats
13.92g
49.93g
55%
Fiber
0g
12.5g
50%
Iron
0.87mg
3.71mg
36%
Phosphorus
246mg
481mg
34%
Vitamin B12
0.7µg
0µg
29%
Cholesterol
80mg
0mg
27%
Calcium
19mg
269mg
25%
Vitamin B6
0.464mg
0.137mg
25%
Calories
242kcal
579kcal
17%
Protein
27.32g
21.15g
12%
Folate
5µg
44µg
10%
Potassium
423mg
733mg
9%
Vitamin B3
5.037mg
3.618mg
9%
Choline
93.9mg
52.1mg
8%
Carbs
0g
21.55g
7%
Vitamin D*
53 IU
0 IU
7%
Vitamin D
1.3µg
0µg
7%
Zinc
2.39mg
3.12mg
7%
Saturated fat
5.23g
3.802g
6%
Vitamin B5
0.698mg
0.471mg
5%
Sodium
62mg
1mg
3%
Vitamin C
0.6mg
0mg
1%
Protein per 100 calories
11g
3.7g
N/A
Calories per 10 g protein
89kcal
274kcal
N/A
Weight per 100 calories
41g
17g
N/A
Unsaturated / Saturated Fat ratio
1.4
12
N/A
Net carbs
0g
9.05g
N/A
Sugar
0g
4.35g
N/A
Starch
0.72g
0%
Vitamin A
2µg
0µg
0%
Trans fat
0.015g
N/A
Tryptophan
0.338mg
0.211mg
0%
Threonine
1.234mg
0.601mg
0%
Isoleucine
1.26mg
0.751mg
0%
Leucine
2.177mg
1.473mg
0%
Lysine
2.446mg
0.568mg
0%
Methionine
0.712mg
0.157mg
0%
Phenylalanine
1.086mg
1.132mg
0%
Valine
1.473mg
0.855mg
0%
Histidine
1.067mg
0.539mg
0%
Fructose
0.11g
0%
Omega-3 - ALA
0.003g
N/A
Omega-6 - Eicosadienoic acid
0.002g
N/A
Omega-6 - Linoleic acid
12.32g
N/A
Macronutrient Comparison
Macronutrient breakdown side-by-side comparison
2
27%
14%
58%
Protein:
27.32 g
Fats:
13.92 g
Carbs:
0 g
Water:
57.87 g
Other:
0.89 g
3
21%
50%
22%
4%
3%
Protein:
21.15 g
Fats:
49.93 g
Carbs:
21.55 g
Water:
4.41 g
Other:
2.96 g
Contains
more
Protein Protein
+29.2%
Contains
more
Water Water
+1212.2%
Contains
more
Fats Fats
+258.7%
Contains
more
Carbs Carbs
+∞%
Contains
more
Other Other
+232.6%
Fat Type Comparison
Fat type breakdown side-by-side comparison
0
41%
49%
10%
Saturated fat:
Sat. Fat
5.23 g
Monounsaturated fat:
Mono. Fat
6.19 g
Polyunsaturated fat:
Poly. Fat
1.2 g
3
8%
66%
26%
Saturated fat:
Sat. Fat
3.802 g
Monounsaturated fat:
Mono. Fat
31.551 g
Polyunsaturated fat:
Poly. Fat
12.329 g
Contains
less
Sat. Fat Saturated fat
-27.3%
Contains
more
Mono. Fat Monounsaturated fat
+409.7%
Contains
more
Poly. Fat Polyunsaturated fat
+927.4%