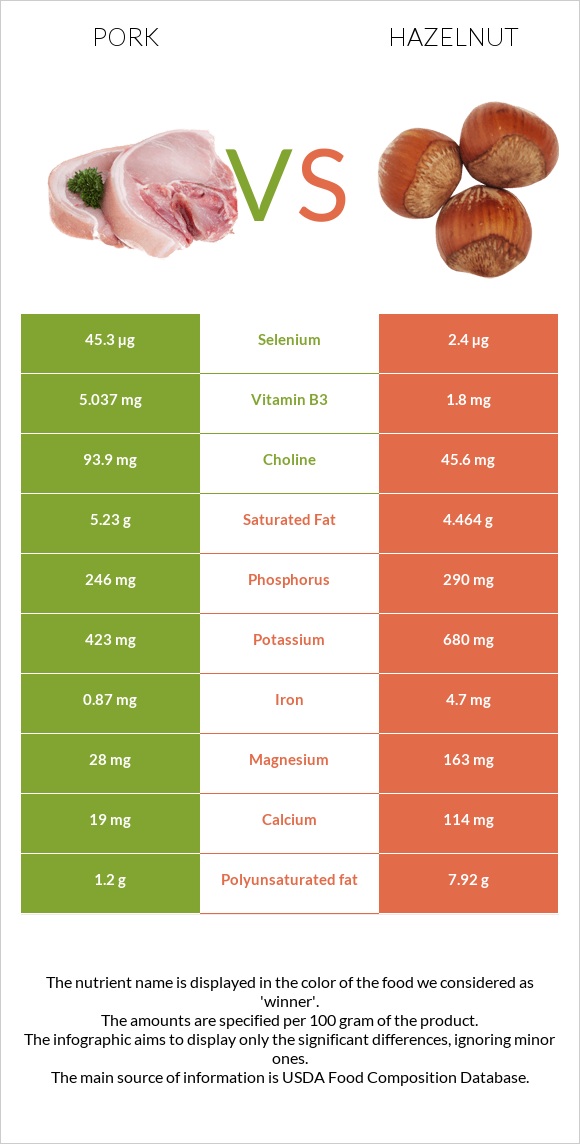
Important differences between pork and hazelnut Pork has more selenium and vitamin B12; however, hazelnut is richer in manganese, copper, vitamin E, iron, fiber, magnesium, and folate. Hazelnut's daily need coverage for manganese is 268% more. Hazelnut contains less cholesterol. Hazelnut has a higher glycemic index. The glycemic index of hazelnut is 15, while the glycemic index of pork is 0. The food varieties used in the comparison are Pork, fresh, loin, whole, separable lean, and fat, cooked, broiled and Nuts, hazelnuts or filberts .
Infographic
Mineral Comparison
Mineral comparison score is based on the number of minerals by which one or the other food is richer. The "coverage" charts below show how much of the daily needs can be covered by 300 grams of the food.
1
100 g
300 g
3 oz - 85g 1 chop, excluding refuse (yield from 1 raw chop, with refuse, weighing 151 g) - 87g
Magnesium
Magnesium
Calcium
Calcium
Potassium
Potassium
Iron
Iron
Copper
Copper
Zinc
Zinc
Phosphorus
Phosphorus
Sodium
Sodium
Manganese
Manganese
Selenium
Selenium
20%
5.7%
37%
33%
24%
65%
105%
8.1%
1.2%
247%
8
100 g
300 g
10 nuts - 14g 1 oz (21 whole kernels) - 28.35g 1 cup, ground - 75g 1 cup, chopped - 115g 1 cup, whole - 135g
Magnesium
Magnesium
Calcium
Calcium
Potassium
Potassium
Iron
Iron
Copper
Copper
Zinc
Zinc
Phosphorus
Phosphorus
Sodium
Sodium
Manganese
Manganese
Selenium
Selenium
116%
34%
60%
176%
575%
67%
124%
0%
805%
13%
Vitamin Comparison
Vitamin comparison score is based on the number of vitamins by which one or the other food is richer. The "coverage" charts below show how much of the daily needs can be covered by 300 grams of the food.
6
100 g
300 g
3 oz - 85g 1 chop, excluding refuse (yield from 1 raw chop, with refuse, weighing 151 g) - 87g
Vitamin C
Vit. C
Vitamin D
Vit. D
Vitamin A
Vit. A
Vitamin E
Vit. E
Vitamin B1
Vit. B1
Vitamin B2
Vit. B2
Vitamin B3
Vit. B3
Vitamin B5
Vit. B5
Vitamin B6
Vit. B6
Vitamin B12
Vit. B12
Vitamin K
Vit. K
Folate
Folate
2%
20%
0.67%
5.8%
219%
74%
94%
42%
107%
88%
0%
3.8%
6
100 g
300 g
10 nuts - 14g 1 oz (21 whole kernels) - 28.35g 1 cup, ground - 75g 1 cup, chopped - 115g 1 cup, whole - 135g
Vitamin C
Vit. C
Vitamin D
Vit. D
Vitamin A
Vit. A
Vitamin E
Vit. E
Vitamin B1
Vit. B1
Vitamin B2
Vit. B2
Vitamin B3
Vit. B3
Vitamin B5
Vit. B5
Vitamin B6
Vit. B6
Vitamin B12
Vit. B12
Vitamin K
Vit. K
Folate
Folate
21%
0%
0.33%
301%
161%
26%
34%
55%
130%
0%
36%
85%
All nutrients comparison - raw data values
Nutrient
DV% diff.
Manganese
0.009mg
6.175mg
268%
Copper
0.073mg
1.725mg
184%
Monounsaturated fat
6.19g
45.652g
99%
Vitamin E
0.29mg
15.03mg
98%
Selenium
45.3µg
2.4µg
78%
Fats
13.92g
60.75g
72%
Iron
0.87mg
4.7mg
48%
Polyunsaturated fat
1.2g
7.92g
45%
Fiber
0g
9.7g
39%
Magnesium
28mg
163mg
32%
Vitamin B12
0.7µg
0µg
29%
Cholesterol
80mg
0mg
27%
Folate
5µg
113µg
27%
Protein
27.32g
14.95g
25%
Vitamin B1
0.877mg
0.643mg
20%
Vitamin B3
5.037mg
1.8mg
20%
Calories
242kcal
628kcal
19%
Vitamin B2
0.321mg
0.113mg
16%
Vitamin K
0µg
14.2µg
12%
Calcium
19mg
114mg
10%
Choline
93.9mg
45.6mg
9%
Potassium
423mg
680mg
8%
Vitamin B6
0.464mg
0.563mg
8%
Vitamin D*
53 IU
0 IU
7%
Vitamin D
1.3µg
0µg
7%
Vitamin C
0.6mg
6.3mg
6%
Carbs
0g
16.7g
6%
Phosphorus
246mg
290mg
6%
Vitamin B5
0.698mg
0.918mg
4%
Sodium
62mg
0mg
3%
Saturated fat
5.23g
4.464g
3%
Zinc
2.39mg
2.45mg
1%
Protein per 100 calories
11g
2.4g
N/A
Calories per 10 g protein
89kcal
420kcal
N/A
Weight per 100 calories
41g
16g
N/A
Unsaturated / Saturated Fat ratio
1.4
12
N/A
Net carbs
0g
7g
N/A
Sugar
0g
4.34g
N/A
Starch
0.48g
0%
Vitamin A
2µg
1µg
0%
Tryptophan
0.338mg
0.193mg
0%
Threonine
1.234mg
0.497mg
0%
Isoleucine
1.26mg
0.545mg
0%
Leucine
2.177mg
1.063mg
0%
Lysine
2.446mg
0.42mg
0%
Methionine
0.712mg
0.221mg
0%
Phenylalanine
1.086mg
0.663mg
0%
Valine
1.473mg
0.701mg
0%
Histidine
1.067mg
0.432mg
0%
Fructose
0.07g
0%
Macronutrient Comparison
Macronutrient breakdown side-by-side comparison
2
27%
14%
58%
Protein:
27.32 g
Fats:
13.92 g
Carbs:
0 g
Water:
57.87 g
Other:
0.89 g
3
15%
61%
17%
5%
2%
Protein:
14.95 g
Fats:
60.75 g
Carbs:
16.7 g
Water:
5.31 g
Other:
2.29 g
Contains
more
Protein Protein
+82.7%
Contains
more
Water Water
+989.8%
Contains
more
Fats Fats
+336.4%
Contains
more
Carbs Carbs
+∞%
Contains
more
Other Other
+157.3%
Fat Type Comparison
Fat type breakdown side-by-side comparison
0
41%
49%
10%
Saturated fat:
Sat. Fat
5.23 g
Monounsaturated fat:
Mono. Fat
6.19 g
Polyunsaturated fat:
Poly. Fat
1.2 g
3
8%
79%
14%
Saturated fat:
Sat. Fat
4.464 g
Monounsaturated fat:
Mono. Fat
45.652 g
Polyunsaturated fat:
Poly. Fat
7.92 g
Contains
less
Sat. Fat Saturated fat
-14.6%
Contains
more
Mono. Fat Monounsaturated fat
+637.5%
Contains
more
Poly. Fat Polyunsaturated fat
+560%