Summary of differences between pork and macadamia Pork has more selenium and vitamin B12, while macadamia has more manganese, copper, iron, fiber, vitamin B1, and magnesium. Macadamia covers your daily need for manganese, 179% more than pork. The amount of cholesterol in macadamia is lower. These are the specific foods used in this comparison Pork, fresh, loin, whole, separable lean, and fat, cooked, broiled and Nuts, macadamia nuts, raw .
Infographic
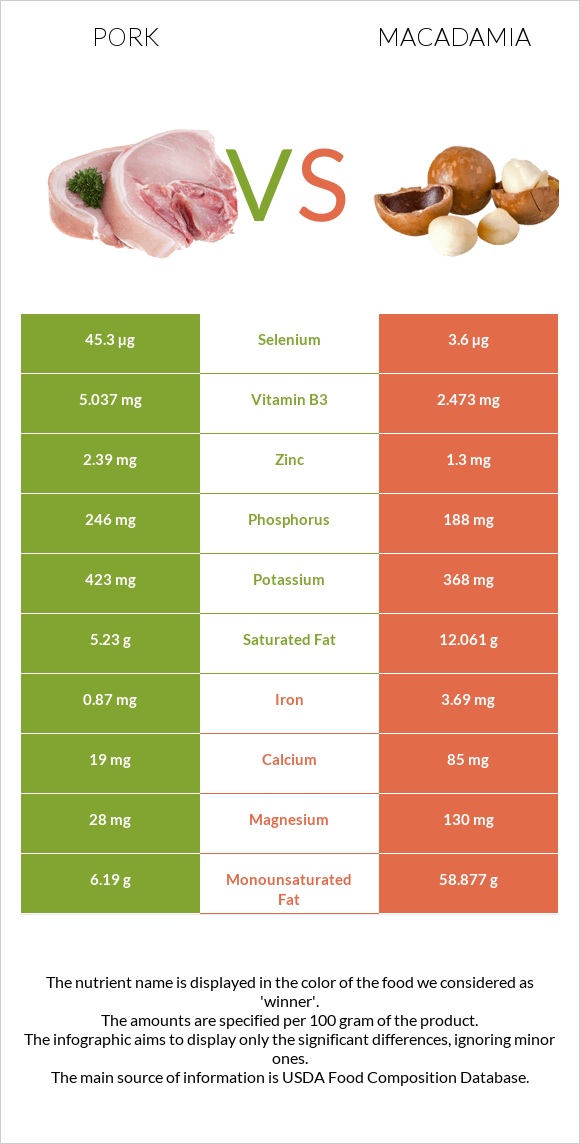
Mineral Comparison
Mineral comparison score is based on the number of minerals by which one or the other food is richer. The "coverage" charts below show how much of the daily needs can be covered by 300 grams of the food.
4
100 g
300 g
3 oz - 85g 1 chop, excluding refuse (yield from 1 raw chop, with refuse, weighing 151 g) - 87g
Magnesium
Magnesium
Calcium
Calcium
Potassium
Potassium
Iron
Iron
Copper
Copper
Zinc
Zinc
Phosphorus
Phosphorus
Sodium
Sodium
Manganese
Manganese
Selenium
Selenium
20%
5.7%
37%
33%
24%
65%
105%
8.1%
1.2%
247%
6
100 g
300 g
1 oz (10-12 kernels) - 28.35g 1 cup, whole or halves - 134g
Magnesium
Magnesium
Calcium
Calcium
Potassium
Potassium
Iron
Iron
Copper
Copper
Zinc
Zinc
Phosphorus
Phosphorus
Sodium
Sodium
Manganese
Manganese
Selenium
Selenium
93%
26%
32%
138%
252%
35%
81%
0.65%
539%
20%
Vitamin Comparison
Vitamin comparison score is based on the number of vitamins by which one or the other food is richer. The "coverage" charts below show how much of the daily needs can be covered by 300 grams of the food.
6
100 g
300 g
3 oz - 85g 1 chop, excluding refuse (yield from 1 raw chop, with refuse, weighing 151 g) - 87g
Vitamin C
Vit. C
Vitamin D
Vit. D
Vitamin A
Vit. A
Vitamin E
Vit. E
Vitamin B1
Vit. B1
Vitamin B2
Vit. B2
Vitamin B3
Vit. B3
Vitamin B5
Vit. B5
Vitamin B6
Vit. B6
Vitamin B12
Vit. B12
Vitamin K
Vit. K
Folate
Folate
2%
20%
0.67%
5.8%
219%
74%
94%
42%
107%
88%
0%
3.8%
4
100 g
300 g
1 oz (10-12 kernels) - 28.35g 1 cup, whole or halves - 134g
Vitamin C
Vit. C
Vitamin D
Vit. D
Vitamin A
Vit. A
Vitamin E
Vit. E
Vitamin B1
Vit. B1
Vitamin B2
Vit. B2
Vitamin B3
Vit. B3
Vitamin B5
Vit. B5
Vitamin B6
Vit. B6
Vitamin B12
Vit. B12
Vitamin K
Vit. K
Folate
Folate
4%
0%
0%
11%
299%
37%
46%
45%
63%
0%
0%
8.3%
All nutrients comparison - raw data values
Nutrient
DV% diff.
Manganese
0.009mg
4.131mg
179%
Monounsaturated fat
6.19g
58.877g
132%
Fats
13.92g
75.77g
95%
Copper
0.073mg
0.756mg
76%
Selenium
45.3µg
3.6µg
76%
Protein
27.32g
7.91g
39%
Iron
0.87mg
3.69mg
35%
Fiber
0g
8.6g
34%
Saturated fat
5.23g
12.061g
31%
Vitamin B12
0.7µg
0µg
29%
Cholesterol
80mg
0mg
27%
Vitamin B1
0.877mg
1.195mg
27%
Calories
242kcal
718kcal
24%
Magnesium
28mg
130mg
24%
Choline
93.9mg
17%
Vitamin B3
5.037mg
2.473mg
16%
Vitamin B6
0.464mg
0.275mg
15%
Vitamin B2
0.321mg
0.162mg
12%
Zinc
2.39mg
1.3mg
10%
Phosphorus
246mg
188mg
8%
Vitamin D*
53 IU
0 IU
7%
Vitamin D
1.3µg
0µg
7%
Calcium
19mg
85mg
7%
Carbs
0g
13.82g
5%
Potassium
423mg
368mg
2%
Sodium
62mg
5mg
2%
Vitamin E
0.29mg
0.54mg
2%
Folate
5µg
11µg
2%
Polyunsaturated fat
1.2g
1.502g
2%
Vitamin C
0.6mg
1.2mg
1%
Vitamin B5
0.698mg
0.758mg
1%
Protein per 100 calories
11g
1.1g
N/A
Calories per 10 g protein
89kcal
908kcal
N/A
Weight per 100 calories
41g
14g
N/A
Unsaturated / Saturated Fat ratio
1.4
5
N/A
Net carbs
0g
5.22g
N/A
Sugar
0g
4.57g
N/A
Starch
1.05g
0%
Vitamin A
2µg
0µg
0%
Tryptophan
0.338mg
0.067mg
0%
Threonine
1.234mg
0.37mg
0%
Isoleucine
1.26mg
0.314mg
0%
Leucine
2.177mg
0.602mg
0%
Lysine
2.446mg
0.018mg
0%
Methionine
0.712mg
0.023mg
0%
Phenylalanine
1.086mg
0.665mg
0%
Valine
1.473mg
0.363mg
0%
Histidine
1.067mg
0.195mg
0%
Fructose
0.07g
0%
Macronutrient Comparison
Macronutrient breakdown side-by-side comparison
2
27%
14%
58%
Protein:
27.32 g
Fats:
13.92 g
Carbs:
0 g
Water:
57.87 g
Other:
0.89 g
3
8%
76%
14%
Protein:
7.91 g
Fats:
75.77 g
Carbs:
13.82 g
Water:
1.36 g
Other:
1.14 g
Contains
more
Protein Protein
+245.4%
Contains
more
Water Water
+4155.1%
Contains
more
Fats Fats
+444.3%
Contains
more
Carbs Carbs
+∞%
Contains
more
Other Other
+28.1%
Fat Type Comparison
Fat type breakdown side-by-side comparison
1
41%
49%
10%
Saturated fat:
Sat. Fat
5.23 g
Monounsaturated fat:
Mono. Fat
6.19 g
Polyunsaturated fat:
Poly. Fat
1.2 g
2
17%
81%
2%
Saturated fat:
Sat. Fat
12.061 g
Monounsaturated fat:
Mono. Fat
58.877 g
Polyunsaturated fat:
Poly. Fat
1.502 g
Contains
less
Sat. Fat Saturated fat
-56.6%
Contains
more
Mono. Fat Monounsaturated fat
+851.2%
Contains
more
Poly. Fat Polyunsaturated fat
+25.2%