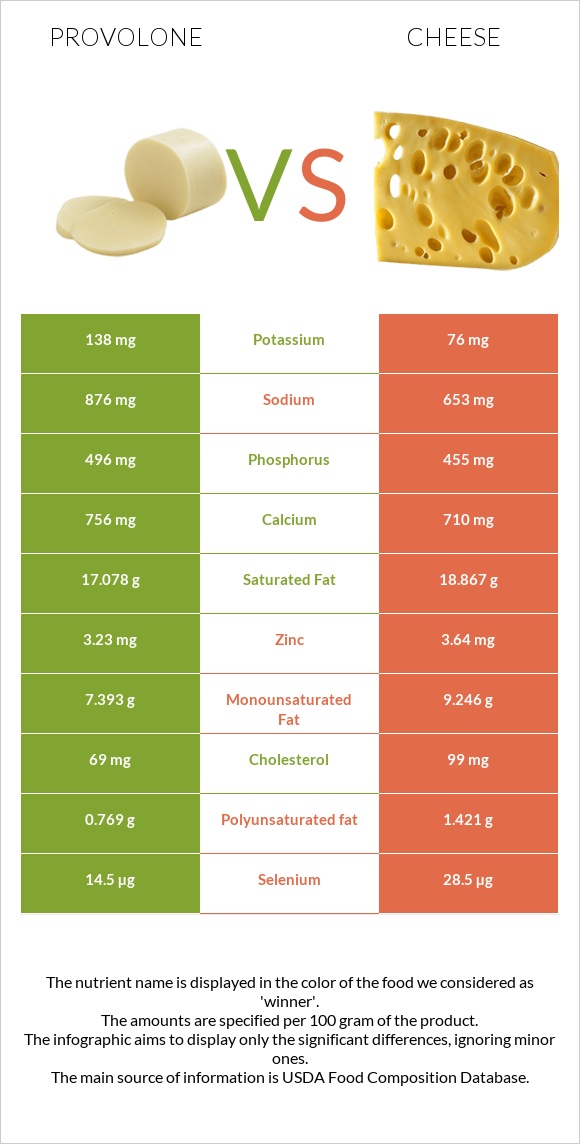
The main differences between provolone and cheese Provolone is richer in vitamin B12 and phosphorus, yet cheese is richer in selenium, vitamin B2, and vitamin A. Daily need coverage for selenium for cheese is 25% higher. Cheese has a lower glycemic index than provolone. Food types used in this article are Cheese, provolone and Cheese, cheddar .
Infographic
Mineral Comparison
Mineral comparison score is based on the number of minerals by which one or the other food is richer. The "coverage" charts below show how much of the daily needs can be covered by 300 grams of the food.
2
100 g
300 g
1 cubic inch - 17g 1 slice (1 oz) - 28g 1 oz - 28.35g 1 cup, diced - 132g 1 package (6 oz) - 170g
Magnesium
Magnesium
Calcium
Calcium
Potassium
Potassium
Iron
Iron
Copper
Copper
Zinc
Zinc
Phosphorus
Phosphorus
Sodium
Sodium
Manganese
Manganese
Selenium
Selenium
20%
227%
12%
20%
8.7%
88%
213%
114%
1.3%
79%
5
100 g
300 g
1 cubic inch - 17g 1 slice (1 oz) - 28g 1 oz - 28.35g 1 cup, shredded - 113g 1 cup, diced - 132g 1 cup, melted - 244g
Magnesium
Magnesium
Calcium
Calcium
Potassium
Potassium
Iron
Iron
Copper
Copper
Zinc
Zinc
Phosphorus
Phosphorus
Sodium
Sodium
Manganese
Manganese
Selenium
Selenium
19%
213%
6.7%
5.3%
10%
99%
195%
85%
3.5%
155%
Vitamin Comparison
Vitamin comparison score is based on the number of vitamins by which one or the other food is richer. The "coverage" charts below show how much of the daily needs can be covered by 300 grams of the food.
3
100 g
300 g
1 cubic inch - 17g 1 slice (1 oz) - 28g 1 oz - 28.35g 1 cup, diced - 132g 1 package (6 oz) - 170g
Vitamin C
Vit. C
Vitamin D
Vit. D
Vitamin A
Vit. A
Vitamin E
Vit. E
Vitamin B1
Vit. B1
Vitamin B2
Vit. B2
Vitamin B3
Vit. B3
Vitamin B5
Vit. B5
Vitamin B6
Vit. B6
Vitamin B12
Vit. B12
Vitamin K
Vit. K
Folate
Folate
0%
7.5%
79%
4.6%
4.8%
74%
2.9%
29%
17%
183%
5.5%
7.5%
6
100 g
300 g
1 cubic inch - 17g 1 slice (1 oz) - 28g 1 oz - 28.35g 1 cup, shredded - 113g 1 cup, diced - 132g 1 cup, melted - 244g
Vitamin C
Vit. C
Vitamin D
Vit. D
Vitamin A
Vit. A
Vitamin E
Vit. E
Vitamin B1
Vit. B1
Vitamin B2
Vit. B2
Vitamin B3
Vit. B3
Vitamin B5
Vit. B5
Vitamin B6
Vit. B6
Vitamin B12
Vit. B12
Vitamin K
Vit. K
Folate
Folate
0%
9%
110%
14%
7.3%
99%
1.1%
25%
15%
138%
6%
20%
All nutrients comparison - raw data values
Nutrient
DV% diff.
Selenium
14.5µg
28.5µg
25%
Vitamin B12
1.46µg
1.1µg
15%
Fats
26.62g
33.31g
10%
Cholesterol
69mg
99mg
10%
Sodium
876mg
653mg
10%
Vitamin A
236µg
330µg
10%
Vitamin B2
0.321mg
0.428mg
8%
Saturated fat
17.078g
18.867g
8%
Phosphorus
496mg
455mg
6%
Protein
25.58g
22.87g
5%
Calcium
756mg
710mg
5%
Iron
0.52mg
0.14mg
5%
Monounsaturated fat
7.393g
9.246g
5%
Zinc
3.23mg
3.64mg
4%
Folate
10µg
27µg
4%
Polyunsaturated fat
0.769g
1.421g
4%
Calories
351kcal
404kcal
3%
Vitamin E
0.23mg
0.71mg
3%
Potassium
138mg
76mg
2%
Vitamin D*
20 IU
24 IU
1%
Vitamin D
0.5µg
0.6µg
1%
Manganese
0.01mg
0.027mg
1%
Vitamin B1
0.019mg
0.029mg
1%
Vitamin B3
0.156mg
0.059mg
1%
Vitamin B5
0.476mg
0.41mg
1%
Vitamin B6
0.073mg
0.066mg
1%
Protein per 100 calories
7.3g
5.7g
N/A
Calories per 10 g protein
137kcal
177kcal
N/A
Weight per 100 calories
28g
25g
N/A
Unsaturated / Saturated Fat ratio
0.48
0.57
N/A
Net carbs
2.14g
3.09g
N/A
Carbs
2.14g
3.09g
0%
Magnesium
28mg
27mg
0%
Sugar
0.56g
0.48g
N/A
Copper
0.026mg
0.03mg
0%
Vitamin K
2.2µg
2.4µg
0%
Trans fat
0.917g
N/A
Choline
15.4mg
16.5mg
0%
Tryptophan
0.345mg
0.547mg
0%
Threonine
0.982mg
1.044mg
0%
Isoleucine
1.091mg
1.206mg
0%
Leucine
2.297mg
1.939mg
0%
Lysine
2.646mg
1.025mg
0%
Methionine
0.686mg
0.547mg
0%
Phenylalanine
1.287mg
1.074mg
0%
Valine
1.64mg
1.404mg
0%
Histidine
1.115mg
0.547mg
0%
Omega-3 - EPA
0g
0.01g
N/A
Omega-3 - DHA
0g
0.001g
N/A
Omega-3 - DPA
0g
0.017g
N/A
Omega-6 - Eicosadienoic acid
0.007g
N/A
Macronutrient Comparison
Macronutrient breakdown side-by-side comparison
3
26%
27%
2%
41%
5%
Protein:
25.58 g
Fats:
26.62 g
Carbs:
2.14 g
Water:
40.95 g
Other:
4.71 g
2
23%
33%
3%
37%
4%
Protein:
22.87 g
Fats:
33.31 g
Carbs:
3.09 g
Water:
37.02 g
Other:
3.71 g
Contains
more
Protein Protein
+11.8%
Contains
more
Other Other
+27%
Contains
more
Fats Fats
+25.1%
Contains
more
Carbs Carbs
+44.4%
Fat Type Comparison
Fat type breakdown side-by-side comparison
1
68%
29%
3%
Saturated fat:
Sat. Fat
17.078 g
Monounsaturated fat:
Mono. Fat
7.393 g
Polyunsaturated fat:
Poly. Fat
0.769 g
2
64%
31%
5%
Saturated fat:
Sat. Fat
18.867 g
Monounsaturated fat:
Mono. Fat
9.246 g
Polyunsaturated fat:
Poly. Fat
1.421 g
Contains
less
Sat. Fat Saturated fat
-9.5%
Contains
more
Mono. Fat Monounsaturated fat
+25.1%
Contains
more
Poly. Fat Polyunsaturated fat
+84.8%