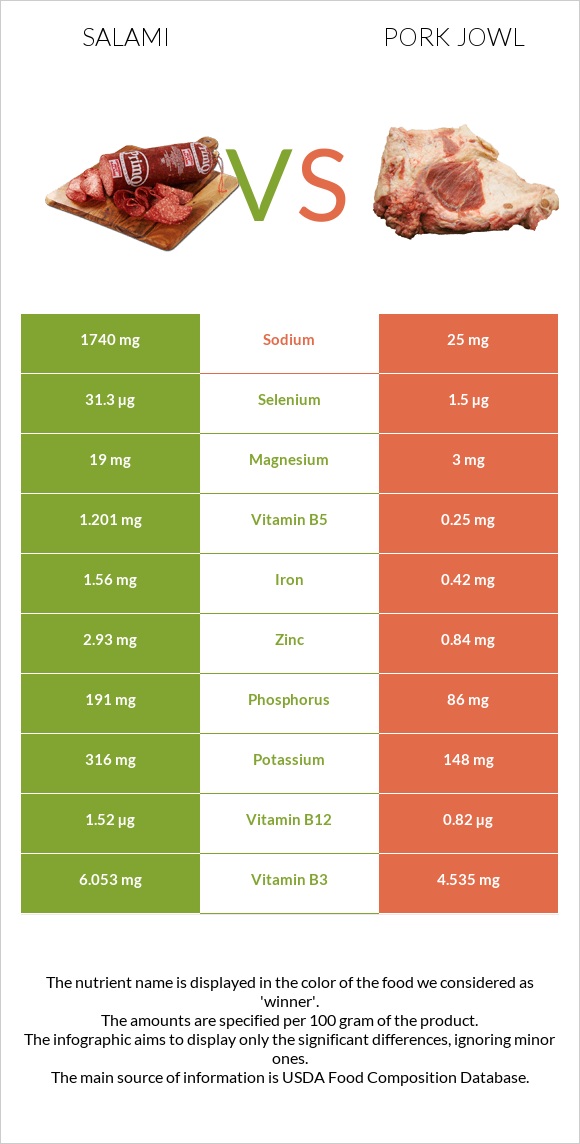
The main differences between salami and pork jowl Salami is richer than pork jowl in selenium, manganese, copper, vitamin B12, vitamin B6, vitamin B5, zinc, and phosphorus. Daily need coverage for saturated fat for pork jowl is 80% higher. Salami contains 196 times more manganese than pork jowl. Salami contains 0.978mg of manganese, while pork jowl contains 0.005mg. Pork jowl contains less sodium. Pork jowl has a lower glycemic index than salami. Food types used in this article are Salami, cooked, beef, and pork and Pork, fresh, variety meats, and by-products, jowl, raw .
Infographic
Mineral Comparison
Mineral comparison score is based on the number of minerals by which one or the other food is richer. The "coverage" charts below show how much of the daily needs can be covered by 300 grams of the food.
9
100 g
300 g
1 slice round - 12.3g
Magnesium
Magnesium
Calcium
Calcium
Potassium
Potassium
Iron
Iron
Copper
Copper
Zinc
Zinc
Phosphorus
Phosphorus
Sodium
Sodium
Manganese
Manganese
Selenium
Selenium
14%
4.5%
28%
59%
119%
80%
82%
227%
128%
171%
1
100 g
300 g
1 oz - 28.35g 4 oz - 113g
Magnesium
Magnesium
Calcium
Calcium
Potassium
Potassium
Iron
Iron
Copper
Copper
Zinc
Zinc
Phosphorus
Phosphorus
Sodium
Sodium
Manganese
Manganese
Selenium
Selenium
2.1%
1.2%
13%
16%
13%
23%
37%
3.3%
0.65%
8.2%
Vitamin Comparison
Vitamin comparison score is based on the number of vitamins by which one or the other food is richer. The "coverage" charts below show how much of the daily needs can be covered by 300 grams of the food.
8
100 g
300 g
1 slice round - 12.3g
Vitamin C
Vit. C
Vitamin D
Vit. D
Vitamin A
Vit. A
Vitamin E
Vit. E
Vitamin B1
Vit. B1
Vitamin B2
Vit. B2
Vitamin B3
Vit. B3
Vitamin B5
Vit. B5
Vitamin B6
Vit. B6
Vitamin B12
Vit. B12
Vitamin K
Vit. K
Folate
Folate
0%
15%
0%
4.4%
92%
82%
113%
72%
106%
190%
8%
2.3%
2
100 g
300 g
1 oz - 28.35g 4 oz - 113g
Vitamin C
Vit. C
Vitamin D
Vit. D
Vitamin A
Vit. A
Vitamin E
Vit. E
Vitamin B1
Vit. B1
Vitamin B2
Vit. B2
Vitamin B3
Vit. B3
Vitamin B5
Vit. B5
Vitamin B6
Vit. B6
Vitamin B12
Vit. B12
Vitamin K
Vit. K
Folate
Folate
0%
0%
1%
5.8%
97%
54%
85%
15%
21%
103%
0%
0.75%
All nutrients comparison - raw data values
Nutrient
DV% diff.
Sodium
1740mg
25mg
75%
Saturated fat
9.316g
25.26g
72%
Fats
25.9g
69.61g
67%
Selenium
31.3µg
1.5µg
54%
Monounsaturated fat
11.127g
32.89g
54%
Manganese
0.978mg
0.005mg
42%
Polyunsaturated fat
2.529g
8.11g
37%
Copper
0.357mg
0.04mg
35%
Protein
21.85g
6.38g
31%
Vitamin B12
1.52µg
0.82µg
29%
Vitamin B6
0.459mg
0.09mg
28%
Zinc
2.93mg
0.84mg
19%
Vitamin B5
1.201mg
0.25mg
19%
Choline
93.5mg
17%
Calories
336kcal
655kcal
16%
Phosphorus
191mg
86mg
15%
Iron
1.56mg
0.42mg
14%
Vitamin B2
0.357mg
0.236mg
9%
Vitamin B3
6.053mg
4.535mg
9%
Vitamin D*
41 IU
5%
Vitamin D
1µg
5%
Potassium
316mg
148mg
5%
Magnesium
19mg
3mg
4%
Vitamin K
3.2µg
3%
Vitamin B1
0.367mg
0.386mg
2%
Carbs
2.4g
0g
1%
Calcium
15mg
4mg
1%
Folate
3µg
1µg
1%
Protein per 100 calories
6.5g
0.97g
N/A
Calories per 10 g protein
154kcal
1027kcal
N/A
Weight per 100 calories
30g
15g
N/A
Unsaturated / Saturated Fat ratio
1.5
1.6
N/A
Net carbs
2.4g
0g
N/A
Cholesterol
89mg
90mg
0%
Sugar
0.96g
0g
N/A
Vitamin A
0µg
3µg
0%
Vitamin E
0.22mg
0.29mg
0%
Trans fat
0.586g
N/A
Tryptophan
0.114mg
0.021mg
0%
Threonine
0.521mg
0.21mg
0%
Isoleucine
0.675mg
0.168mg
0%
Leucine
0.929mg
0.446mg
0%
Lysine
1.107mg
0.528mg
0%
Methionine
0.301mg
0.095mg
0%
Phenylalanine
0.481mg
0.239mg
0%
Valine
0.668mg
0.305mg
0%
Histidine
0.359mg
0.072mg
0%
Omega-3 - ALA
0.126g
N/A
Omega-6 - Eicosadienoic acid
0.084g
N/A
Omega-6 - Linoleic acid
2.104g
N/A
Macronutrient Comparison
Macronutrient breakdown side-by-side comparison
4
22%
26%
2%
45%
5%
Protein:
21.85 g
Fats:
25.9 g
Carbs:
2.4 g
Water:
45.19 g
Other:
4.66 g
1
6%
70%
22%
2%
Protein:
6.38 g
Fats:
69.61 g
Carbs:
0 g
Water:
22.19 g
Other:
1.82 g
Contains
more
Protein Protein
+242.5%
Contains
more
Carbs Carbs
+∞%
Contains
more
Water Water
+103.7%
Contains
more
Other Other
+156%
Contains
more
Fats Fats
+168.8%
Fat Type Comparison
Fat type breakdown side-by-side comparison
1
41%
48%
11%
Saturated fat:
Sat. Fat
9.316 g
Monounsaturated fat:
Mono. Fat
11.127 g
Polyunsaturated fat:
Poly. Fat
2.529 g
2
38%
50%
12%
Saturated fat:
Sat. Fat
25.26 g
Monounsaturated fat:
Mono. Fat
32.89 g
Polyunsaturated fat:
Poly. Fat
8.11 g
Contains
less
Sat. Fat Saturated fat
-63.1%
Contains
more
Mono. Fat Monounsaturated fat
+195.6%
Contains
more
Poly. Fat Polyunsaturated fat
+220.7%