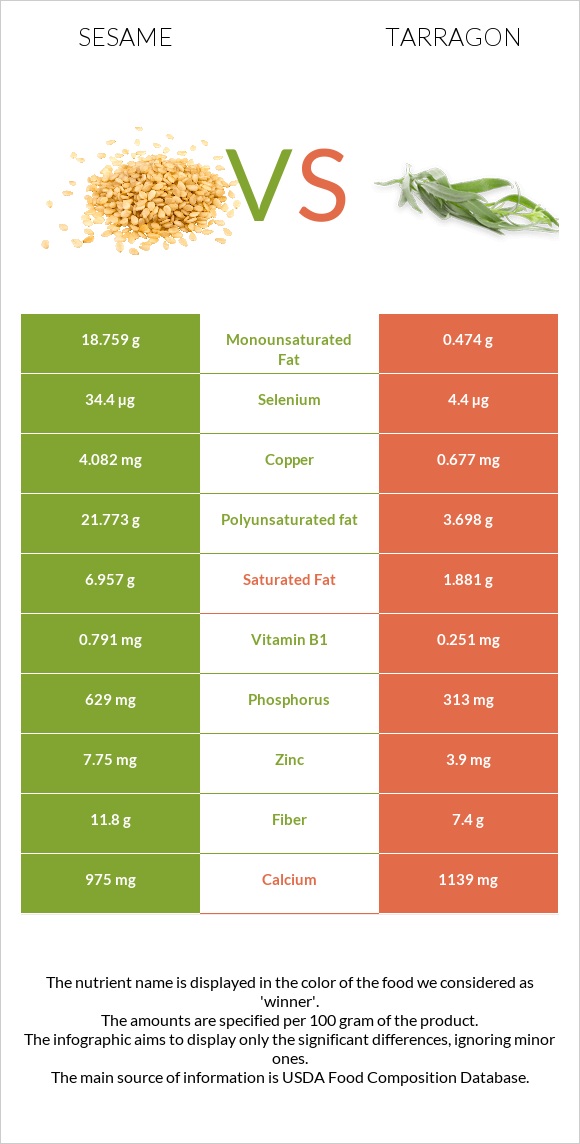
The main differences between sesame and tarragon Sesame has more copper, selenium, and phosphorus; however, tarragon has more manganese, iron, vitamin B6, vitamin B2, vitamin A, potassium, and vitamin C. Daily need coverage for copper for sesame is 378% higher. Tarragon has 8 times less selenium than sesame. Sesame has 34.4µg of selenium, while tarragon has 4.4µg. Food types used in this article are Seeds, sesame seeds, whole, dried and Spices, tarragon, dried .
Infographic
Mineral Comparison
Mineral comparison score is based on the number of minerals by which one or the other food is richer. The "coverage" charts below show how much of the daily needs can be covered by 300 grams of the food.
5
100 g
300 g
1 tbsp - 9g 1 cup - 144g
Magnesium
Magnesium
Calcium
Calcium
Potassium
Potassium
Iron
Iron
Copper
Copper
Zinc
Zinc
Phosphorus
Phosphorus
Sodium
Sodium
Manganese
Manganese
Selenium
Selenium
251%
293%
41%
546%
1361%
211%
270%
1.4%
321%
188%
4
100 g
300 g
0.25 tsp - 0.5g 1 tsp, ground - 1.6g 1 tbsp, leaves - 1.8g 1 tbsp, ground - 4.8g
Magnesium
Magnesium
Calcium
Calcium
Potassium
Potassium
Iron
Iron
Copper
Copper
Zinc
Zinc
Phosphorus
Phosphorus
Sodium
Sodium
Manganese
Manganese
Selenium
Selenium
248%
342%
266%
1211%
226%
106%
134%
8.1%
1039%
24%
Vitamin Comparison
Vitamin comparison score is based on the number of vitamins by which one or the other food is richer. The "coverage" charts below show how much of the daily needs can be covered by 300 grams of the food.
3
100 g
300 g
1 tbsp - 9g 1 cup - 144g
Vitamin C
Vit. C
Vitamin D
Vit. D
Vitamin A
Vit. A
Vitamin E
Vit. E
Vitamin B1
Vit. B1
Vitamin B2
Vit. B2
Vitamin B3
Vit. B3
Vitamin B5
Vit. B5
Vitamin B6
Vit. B6
Vitamin B12
Vit. B12
Vitamin K
Vit. K
Folate
Folate
0%
0%
0%
5%
198%
57%
85%
3%
182%
0%
0%
73%
6
100 g
300 g
0.25 tsp - 0.5g 1 tsp, ground - 1.6g 1 tbsp, leaves - 1.8g 1 tbsp, ground - 4.8g
Vitamin C
Vit. C
Vitamin D
Vit. D
Vitamin A
Vit. A
Vitamin E
Vit. E
Vitamin B1
Vit. B1
Vitamin B2
Vit. B2
Vitamin B3
Vit. B3
Vitamin B5
Vit. B5
Vitamin B6
Vit. B6
Vitamin B12
Vit. B12
Vitamin K
Vit. K
Folate
Folate
167%
0%
70%
0%
63%
309%
168%
0%
556%
0%
0%
206%
All nutrients comparison - raw data values
Nutrient
DV% diff.
Copper
4.082mg
0.677mg
378%
Manganese
2.46mg
7.967mg
239%
Iron
14.55mg
32.3mg
222%
Vitamin B6
0.79mg
2.41mg
125%
Polyunsaturated fat
21.773g
3.698g
121%
Vitamin B2
0.247mg
1.339mg
84%
Potassium
468mg
3020mg
75%
Fats
49.67g
7.24g
65%
Vitamin C
0mg
50mg
56%
Selenium
34.4µg
4.4µg
55%
Monounsaturated fat
18.759g
0.474g
46%
Phosphorus
629mg
313mg
45%
Vitamin B1
0.791mg
0.251mg
45%
Folate
97µg
274µg
44%
Zinc
7.75mg
3.9mg
35%
Vitamin B3
4.515mg
8.95mg
28%
Vitamin A
0µg
210µg
23%
Saturated fat
6.957g
1.881g
23%
Fiber
11.8g
7.4g
18%
Calcium
975mg
1139mg
16%
Calories
573kcal
295kcal
14%
Protein
17.73g
22.77g
10%
Carbs
23.45g
50.22g
9%
Choline
25.6mg
5%
Sodium
11mg
62mg
2%
Vitamin E
0.25mg
2%
Magnesium
351mg
347mg
1%
Vitamin B5
0.05mg
1%
Protein per 100 calories
3.1g
7.7g
N/A
Calories per 10 g protein
323kcal
130kcal
N/A
Weight per 100 calories
17g
34g
N/A
Unsaturated / Saturated Fat ratio
5.8
2.2
N/A
Net carbs
11.65g
42.82g
N/A
Sugar
0.3g
N/A
Tryptophan
0.388mg
0%
Threonine
0.736mg
0%
Isoleucine
0.763mg
0%
Leucine
1.358mg
0%
Lysine
0.569mg
0%
Methionine
0.586mg
0%
Phenylalanine
0.94mg
0%
Valine
0.99mg
0%
Histidine
0.522mg
0%
Macronutrient Comparison
Macronutrient breakdown side-by-side comparison
1
18%
50%
23%
5%
4%
Protein:
17.73 g
Fats:
49.67 g
Carbs:
23.45 g
Water:
4.69 g
Other:
4.46 g
4
23%
7%
50%
8%
12%
Protein:
22.77 g
Fats:
7.24 g
Carbs:
50.22 g
Water:
7.74 g
Other:
12.03 g
Contains
more
Fats Fats
+586%
Contains
more
Protein Protein
+28.4%
Contains
more
Carbs Carbs
+114.2%
Contains
more
Water Water
+65%
Contains
more
Other Other
+169.7%
Fat Type Comparison
Fat type breakdown side-by-side comparison
2
15%
40%
46%
Saturated fat:
Sat. Fat
6.957 g
Monounsaturated fat:
Mono. Fat
18.759 g
Polyunsaturated fat:
Poly. Fat
21.773 g
1
31%
8%
61%
Saturated fat:
Sat. Fat
1.881 g
Monounsaturated fat:
Mono. Fat
0.474 g
Polyunsaturated fat:
Poly. Fat
3.698 g
Contains
more
Mono. Fat Monounsaturated fat
+3857.6%
Contains
more
Poly. Fat Polyunsaturated fat
+488.8%
Contains
less
Sat. Fat Saturated fat
-73%