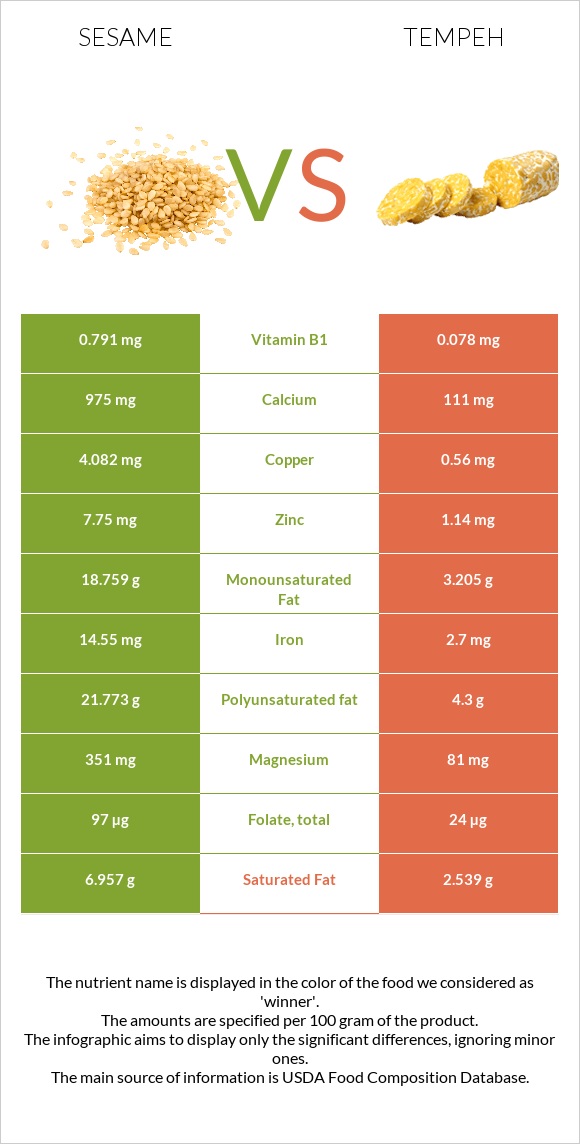
What are the differences between sesame and tempeh? Sesame is richer than tempeh in copper, iron, calcium, magnesium, selenium, zinc, vitamin B1, phosphorus, manganese, and vitamin B6. Sesame's daily need coverage for copper is 391% more. We used Seeds, sesame seeds, whole, dried and Tempeh types in this article.
Infographic
Mineral Comparison
Mineral comparison score is based on the number of minerals by which one or the other food is richer. The "coverage" charts below show how much of the daily needs can be covered by 300 grams of the food.
9
100 g
300 g
1 tbsp - 9g 1 cup - 144g
Magnesium
Magnesium
Calcium
Calcium
Potassium
Potassium
Iron
Iron
Copper
Copper
Zinc
Zinc
Phosphorus
Phosphorus
Sodium
Sodium
Manganese
Manganese
Selenium
Selenium
251%
293%
41%
546%
1361%
211%
270%
1.4%
321%
188%
1
100 g
300 g
1 cup - 166g
Magnesium
Magnesium
Calcium
Calcium
Potassium
Potassium
Iron
Iron
Copper
Copper
Zinc
Zinc
Phosphorus
Phosphorus
Sodium
Sodium
Manganese
Manganese
Selenium
Selenium
58%
33%
36%
101%
187%
31%
114%
1.2%
170%
0%
Vitamin Comparison
Vitamin comparison score is based on the number of vitamins by which one or the other food is richer. The "coverage" charts below show how much of the daily needs can be covered by 300 grams of the food.
5
100 g
300 g
1 tbsp - 9g 1 cup - 144g
Vitamin C
Vit. C
Vitamin D
Vit. D
Vitamin A
Vit. A
Vitamin E
Vit. E
Vitamin B1
Vit. B1
Vitamin B2
Vit. B2
Vitamin B3
Vit. B3
Vitamin B5
Vit. B5
Vitamin B6
Vit. B6
Vitamin B12
Vit. B12
Vitamin K
Vit. K
Folate
Folate
0%
0%
0%
5%
198%
57%
85%
3%
182%
0%
0%
73%
3
100 g
300 g
1 cup - 166g
Vitamin C
Vit. C
Vitamin D
Vit. D
Vitamin A
Vit. A
Vitamin E
Vit. E
Vitamin B1
Vit. B1
Vitamin B2
Vit. B2
Vitamin B3
Vit. B3
Vitamin B5
Vit. B5
Vitamin B6
Vit. B6
Vitamin B12
Vit. B12
Vitamin K
Vit. K
Folate
Folate
0%
0%
0%
0%
20%
83%
50%
17%
50%
10%
0%
18%
All nutrients comparison - raw data values
Nutrient
DV% diff.
Copper
4.082mg
0.56mg
391%
Iron
14.55mg
2.7mg
148%
Polyunsaturated fat
21.773g
4.3g
116%
Calcium
975mg
111mg
86%
Magnesium
351mg
81mg
64%
Selenium
34.4µg
0µg
63%
Fats
49.67g
10.8g
60%
Zinc
7.75mg
1.14mg
60%
Vitamin B1
0.791mg
0.078mg
59%
Phosphorus
629mg
266mg
52%
Manganese
2.46mg
1.3mg
50%
Fiber
11.8g
47%
Vitamin B6
0.79mg
0.215mg
44%
Monounsaturated fat
18.759g
3.205g
39%
Saturated fat
6.957g
2.539g
20%
Calories
573kcal
192kcal
19%
Folate
97µg
24µg
18%
Vitamin B3
4.515mg
2.64mg
12%
Vitamin B2
0.247mg
0.358mg
9%
Protein
17.73g
20.29g
5%
Carbs
23.45g
7.64g
5%
Vitamin B5
0.05mg
0.278mg
5%
Choline
25.6mg
5%
Vitamin B12
0µg
0.08µg
3%
Potassium
468mg
412mg
2%
Vitamin E
0.25mg
2%
Protein per 100 calories
3.1g
11g
N/A
Calories per 10 g protein
323kcal
95kcal
N/A
Weight per 100 calories
17g
52g
N/A
Unsaturated / Saturated Fat ratio
5.8
3
N/A
Net carbs
11.65g
7.64g
N/A
Sugar
0.3g
N/A
Sodium
11mg
9mg
0%
Tryptophan
0.388mg
0.194mg
0%
Threonine
0.736mg
0.796mg
0%
Isoleucine
0.763mg
0.88mg
0%
Leucine
1.358mg
1.43mg
0%
Lysine
0.569mg
0.908mg
0%
Methionine
0.586mg
0.175mg
0%
Phenylalanine
0.94mg
0.893mg
0%
Valine
0.99mg
0.92mg
0%
Histidine
0.522mg
0.466mg
0%
Macronutrient Comparison
Macronutrient breakdown side-by-side comparison
3
18%
50%
23%
5%
4%
Protein:
17.73 g
Fats:
49.67 g
Carbs:
23.45 g
Water:
4.69 g
Other:
4.46 g
2
20%
11%
8%
60%
Protein:
20.29 g
Fats:
10.8 g
Carbs:
7.64 g
Water:
59.65 g
Other:
1.62 g
Contains
more
Fats Fats
+359.9%
Contains
more
Carbs Carbs
+206.9%
Contains
more
Other Other
+175.3%
Contains
more
Protein Protein
+14.4%
Contains
more
Water Water
+1171.9%
Fat Type Comparison
Fat type breakdown side-by-side comparison
2
15%
40%
46%
Saturated fat:
Sat. Fat
6.957 g
Monounsaturated fat:
Mono. Fat
18.759 g
Polyunsaturated fat:
Poly. Fat
21.773 g
1
25%
32%
43%
Saturated fat:
Sat. Fat
2.539 g
Monounsaturated fat:
Mono. Fat
3.205 g
Polyunsaturated fat:
Poly. Fat
4.3 g
Contains
more
Mono. Fat Monounsaturated fat
+485.3%
Contains
more
Poly. Fat Polyunsaturated fat
+406.3%
Contains
less
Sat. Fat Saturated fat
-63.5%