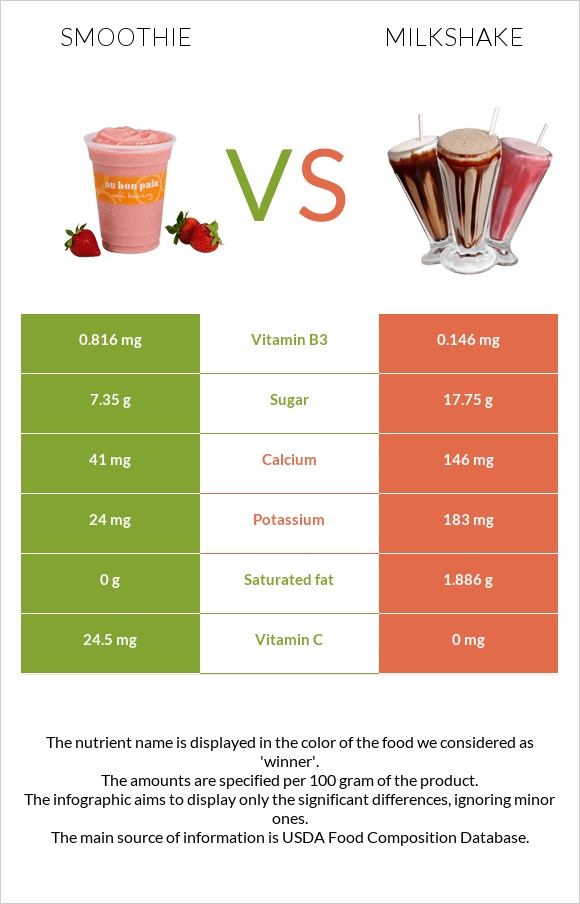
How are smoothie and milkshake different? Smoothie is richer in vitamin C and vitamin A, while milkshake is higher in vitamin B12 and calcium. Smoothie covers your daily need for vitamin C, 27% more than milkshake. Smoothie contains 6 times more vitamin B3 than milkshake. Smoothie contains 0.816mg of vitamin B3, while milkshake contains 0.146mg. Smoothie is lower in sugar. Smoothie has a higher glycemic index (44) than milkshake (27). Beverages, V8 SPLASH Smoothies, Strawberry Banana and Milk shakes, thick vanilla types were used in this article.
Infographic
Mineral Comparison
Mineral comparison score is based on the number of minerals by which one or the other food is richer. The "coverage" charts below show how much of the daily needs can be covered by 300 grams of the food.
2
100 g
300 g
1 serving 8 oz - 245g
Magnesium
Magnesium
Calcium
Calcium
Potassium
Potassium
Iron
Iron
Copper
Copper
Zinc
Zinc
Phosphorus
Phosphorus
Sodium
Sodium
Manganese
Manganese
Selenium
Selenium
0%
12%
2.1%
5.6%
0%
0%
0%
3.8%
0%
0%
8
100 g
300 g
1 fl oz - 28.4g 1 container (11 oz) - 313g
Magnesium
Magnesium
Calcium
Calcium
Potassium
Potassium
Iron
Iron
Copper
Copper
Zinc
Zinc
Phosphorus
Phosphorus
Sodium
Sodium
Manganese
Manganese
Selenium
Selenium
8.6%
44%
16%
3.8%
17%
11%
49%
12%
1.8%
13%
Vitamin Comparison
Vitamin comparison score is based on the number of vitamins by which one or the other food is richer. The "coverage" charts below show how much of the daily needs can be covered by 300 grams of the food.
3
100 g
300 g
1 serving 8 oz - 245g
Vitamin C
Vit. C
Vitamin D
Vit. D
Vitamin A
Vit. A
Vitamin E
Vit. E
Vitamin B1
Vit. B1
Vitamin B2
Vit. B2
Vitamin B3
Vit. B3
Vitamin B5
Vit. B5
Vitamin B6
Vit. B6
Vitamin B12
Vit. B12
Vitamin K
Vit. K
Folate
Folate
82%
0%
0%
0%
0%
0%
15%
0%
19%
30%
0%
0%
9
100 g
300 g
1 fl oz - 28.4g 1 container (11 oz) - 313g
Vitamin C
Vit. C
Vitamin D
Vit. D
Vitamin A
Vit. A
Vitamin E
Vit. E
Vitamin B1
Vit. B1
Vitamin B2
Vit. B2
Vitamin B3
Vit. B3
Vitamin B5
Vit. B5
Vitamin B6
Vit. B6
Vitamin B12
Vit. B12
Vitamin K
Vit. K
Folate
Folate
0%
18%
8.3%
1%
7.5%
45%
2.7%
22%
9.7%
65%
0.5%
5.3%
All nutrients comparison - raw data values
Nutrient
DV% diff.
Vitamin C
24.5mg
0mg
27%
Phosphorus
115mg
16%
Vitamin B2
0.195mg
15%
Vitamin B12
0.24µg
0.52µg
12%
Calcium
41mg
146mg
11%
Saturated fat
0g
1.886g
9%
Vitamin B5
0.368mg
7%
Vitamin D*
48 IU
6%
Vitamin D
1.2µg
6%
Copper
0.051mg
6%
Protein
1.22g
3.86g
5%
Fats
0g
3.03g
5%
Potassium
24mg
183mg
5%
Calories
37kcal
112kcal
4%
Cholesterol
0mg
12mg
4%
Zinc
0.39mg
4%
Selenium
2.3µg
4%
Vitamin B3
0.816mg
0.146mg
4%
Carbs
8.16g
17.75g
3%
Magnesium
12mg
3%
Sodium
29mg
95mg
3%
Vitamin A
25µg
3%
Vitamin B1
0.03mg
3%
Vitamin B6
0.082mg
0.042mg
3%
Choline
14.3mg
3%
Folate
7µg
2%
Monounsaturated fat
0.875g
2%
Iron
0.15mg
0.1mg
1%
Manganese
0.014mg
1%
Polyunsaturated fat
0.113g
1%
Protein per 100 calories
3.3g
3.4g
N/A
Calories per 10 g protein
303kcal
290kcal
N/A
Weight per 100 calories
270g
89g
N/A
Unsaturated / Saturated Fat ratio
0.52
N/A
Net carbs
8.16g
17.75g
N/A
Sugar
7.35g
17.75g
N/A
Vitamin E
0.05mg
0%
Vitamin K
0.2µg
0%
Tryptophan
0.054mg
0%
Threonine
0.174mg
0%
Isoleucine
0.234mg
0%
Leucine
0.378mg
0%
Lysine
0.306mg
0%
Methionine
0.097mg
0%
Phenylalanine
0.186mg
0%
Valine
0.258mg
0%
Histidine
0.105mg
0%
Macronutrient Comparison
Macronutrient breakdown side-by-side comparison
1
8%
90%
Protein:
1.22 g
Fats:
0 g
Carbs:
8.16 g
Water:
90.28 g
Other:
0.34 g
4
4%
3%
18%
74%
Protein:
3.86 g
Fats:
3.03 g
Carbs:
17.75 g
Water:
74.45 g
Other:
0.91 g
Contains
more
Water Water
+21.3%
Contains
more
Protein Protein
+216.4%
Contains
more
Fats Fats
+∞%
Contains
more
Carbs Carbs
+117.5%
Contains
more
Other Other
+167.6%