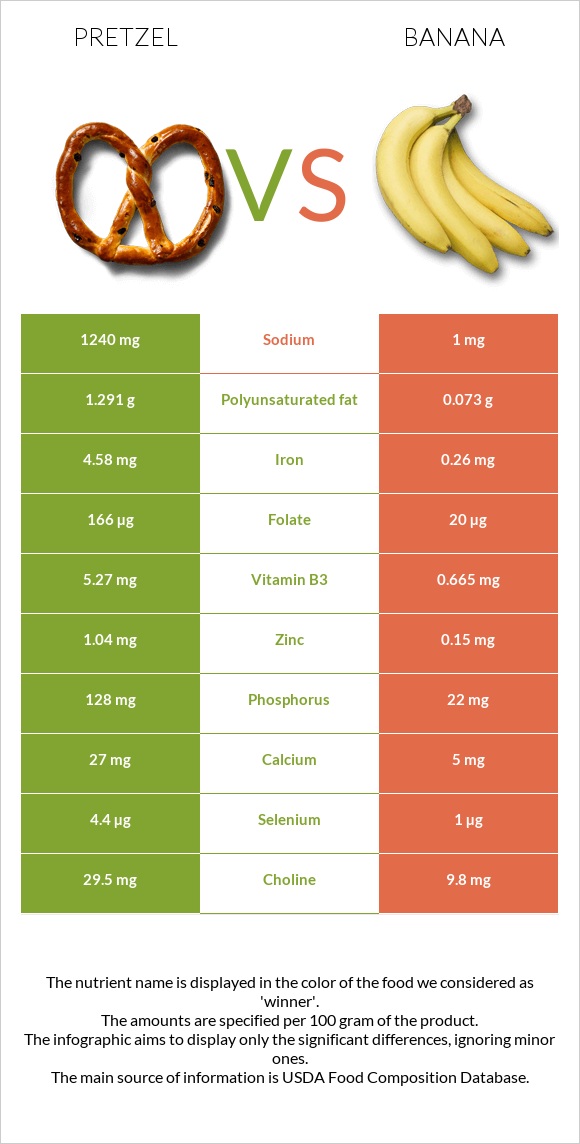
What are the differences between pretzel and bananas? Pretzel is higher in iron, folate, vitamin B1, manganese, vitamin B3, vitamin B2, phosphorus, and copper, yet bananas are higher in vitamin B6. Pretzel's daily need coverage for iron is 54% more. Pretzel has 1240 times more sodium than bananas. While pretzel has 1240mg of sodium, bananas have only 1mg. The glycemic index of bananas is lower. We used Snacks, pretzels, hard, plain, salted and Bananas, raw types in this article.
Infographic
Mineral Comparison
Mineral comparison score is based on the number of minerals by which one or the other food is richer. The "coverage" charts below show how much of the daily needs can be covered by 300 grams of the food.
7
100 g
300 g
1 oz - 28.35g 10 twists - 60g
Magnesium
Magnesium
Calcium
Calcium
Potassium
Potassium
Iron
Iron
Copper
Copper
Zinc
Zinc
Phosphorus
Phosphorus
Sodium
Sodium
Manganese
Manganese
Selenium
Selenium
21%
8.1%
20%
172%
52%
28%
55%
162%
132%
24%
2
100 g
300 g
1 extra small (less than 6" long) - 81g 1 small (6" to 6-7/8" long) - 101g 1 medium (7" to 7-7/8" long) - 118g 1 NLEA serving - 126g 1 large (8" to 8-7/8" long) - 136g 1 cup, sliced - 150g 1 extra large (9" or longer) - 152g 1 cup, mashed - 225g
Magnesium
Magnesium
Calcium
Calcium
Potassium
Potassium
Iron
Iron
Copper
Copper
Zinc
Zinc
Phosphorus
Phosphorus
Sodium
Sodium
Manganese
Manganese
Selenium
Selenium
19%
1.5%
32%
9.8%
26%
4.1%
9.4%
0.13%
35%
5.5%
Vitamin Comparison
Vitamin comparison score is based on the number of vitamins by which one or the other food is richer. The "coverage" charts below show how much of the daily needs can be covered by 300 grams of the food.
6
100 g
300 g
1 oz - 28.35g 10 twists - 60g
Vitamin C
Vit. C
Vitamin D
Vit. D
Vitamin A
Vit. A
Vitamin E
Vit. E
Vitamin B1
Vit. B1
Vitamin B2
Vit. B2
Vitamin B3
Vit. B3
Vitamin B5
Vit. B5
Vitamin B6
Vit. B6
Vitamin B12
Vit. B12
Vitamin K
Vit. K
Folate
Folate
7%
0%
0%
9.4%
106%
77%
99%
19%
17%
0%
7%
125%
3
100 g
300 g
1 extra small (less than 6" long) - 81g 1 small (6" to 6-7/8" long) - 101g 1 medium (7" to 7-7/8" long) - 118g 1 NLEA serving - 126g 1 large (8" to 8-7/8" long) - 136g 1 cup, sliced - 150g 1 extra large (9" or longer) - 152g 1 cup, mashed - 225g
Vitamin C
Vit. C
Vitamin D
Vit. D
Vitamin A
Vit. A
Vitamin E
Vit. E
Vitamin B1
Vit. B1
Vitamin B2
Vit. B2
Vitamin B3
Vit. B3
Vitamin B5
Vit. B5
Vitamin B6
Vit. B6
Vitamin B12
Vit. B12
Vitamin K
Vit. K
Folate
Folate
29%
0%
1%
2%
7.8%
17%
12%
20%
85%
0%
1.3%
15%
All nutrients comparison - raw data values
Nutrient
DV% diff.
Iron
4.58mg
0.26mg
54%
Sodium
1240mg
1mg
54%
Folate
166µg
20µg
37%
Vitamin B1
0.424mg
0.031mg
33%
Manganese
1.015mg
0.27mg
32%
Vitamin B3
5.27mg
0.665mg
29%
Starch
72.58g
5.38g
28%
Vitamin B6
0.074mg
0.367mg
23%
Vitamin B2
0.332mg
0.073mg
20%
Carbs
80.39g
22.84g
19%
Protein
10.04g
1.09g
18%
Calories
384kcal
89kcal
15%
Phosphorus
128mg
22mg
15%
Copper
0.156mg
0.078mg
9%
Zinc
1.04mg
0.15mg
8%
Polyunsaturated fat
1.291g
0.073g
8%
Vitamin C
2.1mg
8.7mg
7%
Selenium
4.4µg
1µg
6%
Fructose
0.31g
4.85g
6%
Fats
2.93g
0.33g
4%
Potassium
223mg
358mg
4%
Choline
29.5mg
9.8mg
4%
Fiber
3.4g
2.6g
3%
Calcium
27mg
5mg
2%
Vitamin E
0.47mg
0.1mg
2%
Vitamin K
2.8µg
0.5µg
2%
Monounsaturated fat
0.727g
0.032g
2%
Saturated fat
0.391g
0.112g
1%
Protein per 100 calories
2.6g
1.2g
N/A
Calories per 10 g protein
382kcal
817kcal
N/A
Weight per 100 calories
26g
112g
N/A
Unsaturated / Saturated Fat ratio
5.2
0.94
N/A
Net carbs
76.99g
20.24g
N/A
Magnesium
29mg
27mg
0%
Sugar
2.21g
12.23g
N/A
Vitamin A
0µg
3µg
0%
Vitamin B5
0.322mg
0.334mg
0%
Trans fat
0.004g
0g
N/A
Tryptophan
0.097mg
0.009mg
0%
Threonine
0.25mg
0.028mg
0%
Isoleucine
0.407mg
0.028mg
0%
Leucine
0.757mg
0.068mg
0%
Lysine
0.257mg
0.05mg
0%
Methionine
0.177mg
0.008mg
0%
Phenylalanine
0.52mg
0.049mg
0%
Valine
0.48mg
0.047mg
0%
Histidine
0.22mg
0.077mg
0%
Omega-3 - ALA
0.063g
N/A
Omega-6 - Gamma-linoleic acid
0.001g
N/A
Omega-6 - Linoleic acid
1.223g
N/A
Macronutrient Comparison
Macronutrient breakdown side-by-side comparison
4
10%
3%
80%
3%
4%
Protein:
10.04 g
Fats:
2.93 g
Carbs:
80.39 g
Water:
3.13 g
Other:
3.51 g
1
23%
75%
Protein:
1.09 g
Fats:
0.33 g
Carbs:
22.84 g
Water:
74.91 g
Other:
0.83 g
Contains
more
Protein Protein
+821.1%
Contains
more
Fats Fats
+787.9%
Contains
more
Carbs Carbs
+252%
Contains
more
Other Other
+322.9%
Contains
more
Water Water
+2293.3%
Fat Type Comparison
Fat type breakdown side-by-side comparison
2
16%
30%
54%
Saturated fat:
Sat. Fat
0.391 g
Monounsaturated fat:
Mono. Fat
0.727 g
Polyunsaturated fat:
Poly. Fat
1.291 g
1
52%
15%
34%
Saturated fat:
Sat. Fat
0.112 g
Monounsaturated fat:
Mono. Fat
0.032 g
Polyunsaturated fat:
Poly. Fat
0.073 g
Contains
more
Mono. Fat Monounsaturated fat
+2171.9%
Contains
more
Poly. Fat Polyunsaturated fat
+1668.5%
Contains
less
Sat. Fat Saturated fat
-71.4%
Carbohydrate type comparison
Carbohydrate type breakdown side-by-side comparison
2
97%
Starch:
72.58 g
Sucrose:
0 g
Glucose:
0.69 g
Fructose:
0.31 g
Lactose:
0 g
Maltose:
1.11 g
Galactose:
0 g
3
31%
14%
28%
28%
Starch:
5.38 g
Sucrose:
2.39 g
Glucose:
4.98 g
Fructose:
4.85 g
Lactose:
0 g
Maltose:
0.01 g
Galactose:
0 g
Contains
more
Starch Starch
+1249.1%
Contains
more
Maltose Maltose
+11000%
Contains
more
Sucrose Sucrose
+∞%
Contains
more
Glucose Glucose
+621.7%
Contains
more
Fructose Fructose
+1464.5%
~equal in
Lactose
~0g
~equal in
Galactose
~0g