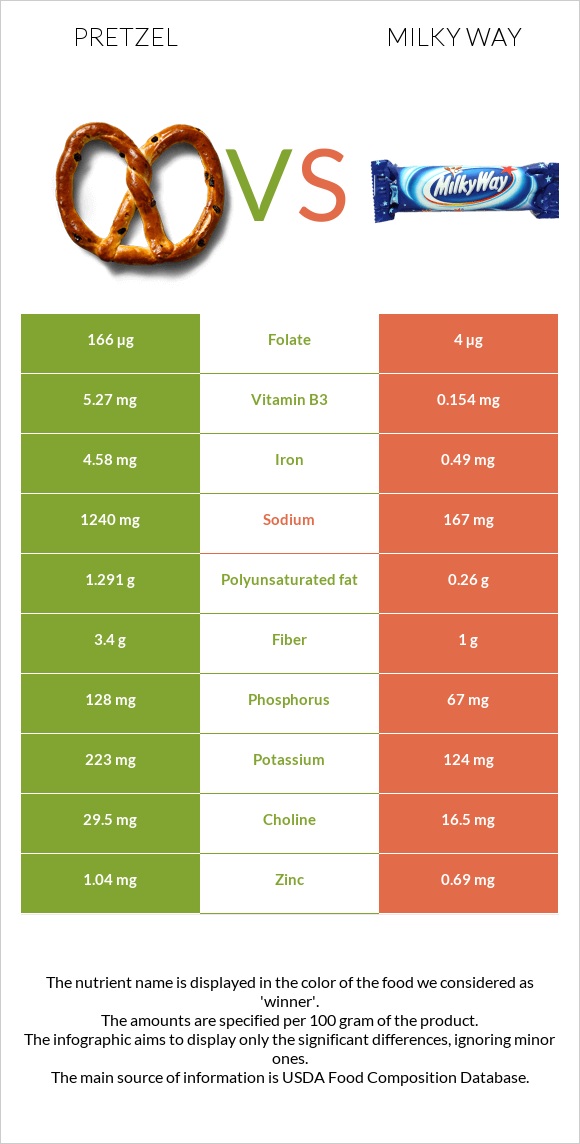
Important differences between pretzel and Milky Way Pretzel has more iron, folate, manganese, vitamin B3, vitamin B1, vitamin B2, and fiber; however, Milky Way has more calcium. Milky Way's daily need coverage for saturated fat is 58% more. Pretzel has 42 times more folate than Milky Way. Pretzel has 166µg of folate, while Milky Way has 4µg. Milky Way is lower in sodium. Pretzel has a higher glycemic index than Milky Way. The food varieties used in the comparison are Snacks, pretzels, hard, plain, salted and Candies, MARS SNACKFOOD US, MILKY WAY Bar .
Infographic
Mineral Comparison
Mineral comparison score is based on the number of minerals by which one or the other food is richer. The "coverage" charts below show how much of the daily needs can be covered by 300 grams of the food.
7
100 g
300 g
1 oz - 28.35g 10 twists - 60g
Magnesium
Magnesium
Calcium
Calcium
Potassium
Potassium
Iron
Iron
Copper
Copper
Zinc
Zinc
Phosphorus
Phosphorus
Sodium
Sodium
Manganese
Manganese
Selenium
Selenium
21%
8.1%
20%
172%
52%
28%
55%
162%
132%
24%
2
100 g
300 g
1 piece miniature 5 pieces = serving - 8.2g 1 bar fun size - 17g 1 serving 2.05 oz bar - 58g 1 bar king size - 103g
Magnesium
Magnesium
Calcium
Calcium
Potassium
Potassium
Iron
Iron
Copper
Copper
Zinc
Zinc
Phosphorus
Phosphorus
Sodium
Sodium
Manganese
Manganese
Selenium
Selenium
14%
35%
11%
18%
49%
19%
29%
22%
19%
11%
Vitamin Comparison
Vitamin comparison score is based on the number of vitamins by which one or the other food is richer. The "coverage" charts below show how much of the daily needs can be covered by 300 grams of the food.
7
100 g
300 g
1 oz - 28.35g 10 twists - 60g
Vitamin C
Vit. C
Vitamin D
Vit. D
Vitamin A
Vit. A
Vitamin E
Vit. E
Vitamin B1
Vit. B1
Vitamin B2
Vit. B2
Vitamin B3
Vit. B3
Vitamin B5
Vit. B5
Vitamin B6
Vit. B6
Vitamin B12
Vit. B12
Vitamin K
Vit. K
Folate
Folate
7%
0%
0%
9.4%
106%
77%
99%
19%
17%
0%
7%
125%
5
100 g
300 g
1 piece miniature 5 pieces = serving - 8.2g 1 bar fun size - 17g 1 serving 2.05 oz bar - 58g 1 bar king size - 103g
Vitamin C
Vit. C
Vitamin D
Vit. D
Vitamin A
Vit. A
Vitamin E
Vit. E
Vitamin B1
Vit. B1
Vitamin B2
Vit. B2
Vitamin B3
Vit. B3
Vitamin B5
Vit. B5
Vitamin B6
Vit. B6
Vitamin B12
Vit. B12
Vitamin K
Vit. K
Folate
Folate
2.3%
6%
10%
18%
12%
24%
2.9%
9.3%
3.2%
23%
9%
3%
All nutrients comparison - raw data values
Nutrient
DV% diff.
Saturated fat
0.391g
12.016g
53%
Iron
4.58mg
0.49mg
51%
Sodium
1240mg
167mg
47%
Folate
166µg
4µg
41%
Manganese
1.015mg
0.147mg
38%
Vitamin B1
0.424mg
0.046mg
32%
Vitamin B3
5.27mg
0.154mg
32%
Starch
72.58g
30%
Fats
2.93g
17.23g
22%
Vitamin B2
0.332mg
0.103mg
18%
Protein
10.04g
4.01g
12%
Fiber
3.4g
1g
10%
Calcium
27mg
115mg
9%
Phosphorus
128mg
67mg
9%
Vitamin B12
0µg
0.18µg
8%
Polyunsaturated fat
1.291g
0.26g
7%
Vitamin B6
0.074mg
0.014mg
5%
Calories
384kcal
456kcal
4%
Selenium
4.4µg
2µg
4%
Monounsaturated fat
0.727g
2.23g
4%
Carbs
80.39g
71.17g
3%
Cholesterol
0mg
9mg
3%
Potassium
223mg
124mg
3%
Zinc
1.04mg
0.69mg
3%
Vitamin A
0µg
31µg
3%
Vitamin E
0.47mg
0.89mg
3%
Vitamin B5
0.322mg
0.155mg
3%
Vitamin C
2.1mg
0.7mg
2%
Vitamin D*
0 IU
16 IU
2%
Vitamin D
0µg
0.4µg
2%
Magnesium
29mg
20mg
2%
Choline
29.5mg
16.5mg
2%
Caffeine
0mg
6mg
2%
Copper
0.156mg
0.147mg
1%
Vitamin K
2.8µg
3.6µg
1%
Protein per 100 calories
2.6g
0.88g
N/A
Calories per 10 g protein
382kcal
1137kcal
N/A
Weight per 100 calories
26g
22g
N/A
Unsaturated / Saturated Fat ratio
5.2
0.21
N/A
Net carbs
76.99g
70.17g
N/A
Sugar
2.21g
59.69g
N/A
Trans fat
0.004g
0.206g
N/A
Tryptophan
0.097mg
0%
Threonine
0.25mg
0%
Isoleucine
0.407mg
0%
Leucine
0.757mg
0%
Lysine
0.257mg
0%
Methionine
0.177mg
0%
Phenylalanine
0.52mg
0%
Valine
0.48mg
0%
Histidine
0.22mg
0%
Fructose
0.31g
0%
Omega-3 - ALA
0.063g
N/A
Omega-6 - Gamma-linoleic acid
0.001g
N/A
Omega-6 - Linoleic acid
1.223g
N/A
Macronutrient Comparison
Macronutrient breakdown side-by-side comparison
3
10%
3%
80%
3%
4%
Protein:
10.04 g
Fats:
2.93 g
Carbs:
80.39 g
Water:
3.13 g
Other:
3.51 g
2
4%
17%
71%
6%
Protein:
4.01 g
Fats:
17.23 g
Carbs:
71.17 g
Water:
6.3 g
Other:
1.29 g
Contains
more
Protein Protein
+150.4%
Contains
more
Carbs Carbs
+13%
Contains
more
Other Other
+172.1%
Contains
more
Fats Fats
+488.1%
Contains
more
Water Water
+101.3%
Fat Type Comparison
Fat type breakdown side-by-side comparison
2
16%
30%
54%
Saturated fat:
Sat. Fat
0.391 g
Monounsaturated fat:
Mono. Fat
0.727 g
Polyunsaturated fat:
Poly. Fat
1.291 g
1
83%
15%
2%
Saturated fat:
Sat. Fat
12.016 g
Monounsaturated fat:
Mono. Fat
2.23 g
Polyunsaturated fat:
Poly. Fat
0.26 g
Contains
less
Sat. Fat Saturated fat
-96.7%
Contains
more
Poly. Fat Polyunsaturated fat
+396.5%
Contains
more
Mono. Fat Monounsaturated fat
+206.7%