Infographic
Mineral Comparison
Mineral comparison score is based on the number of minerals by which one or the other food is richer. The "coverage" charts below show how much of the daily needs can be covered by 300 grams of the food.
9
100 g
300 g
1 oz - 28.35g 10 twists - 60g
Magnesium
Magnesium
Calcium
Calcium
Potassium
Potassium
Iron
Iron
Copper
Copper
Zinc
Zinc
Phosphorus
Phosphorus
Sodium
Sodium
Manganese
Manganese
Selenium
Selenium
21%
8.1%
20%
172%
52%
28%
55%
162%
132%
24%
1
100 g
300 g
1 serving fun size bag - 20g 1 serving 2.1 oz bag - 62g
Magnesium
Magnesium
Calcium
Calcium
Potassium
Potassium
Iron
Iron
Copper
Copper
Zinc
Zinc
Phosphorus
Phosphorus
Sodium
Sodium
Manganese
Manganese
Selenium
Selenium
0%
0%
0%
0%
0%
0%
0%
2%
0%
0%
Vitamin Comparison
Vitamin comparison score is based on the number of vitamins by which one or the other food is richer. The "coverage" charts below show how much of the daily needs can be covered by 300 grams of the food.
8
100 g
300 g
1 oz - 28.35g 10 twists - 60g
Vitamin C
Vit. C
Vitamin D
Vit. D
Vitamin A
Vit. A
Vitamin E
Vit. E
Vitamin B1
Vit. B1
Vitamin B2
Vit. B2
Vitamin B3
Vit. B3
Vitamin B5
Vit. B5
Vitamin B6
Vit. B6
Vitamin B12
Vit. B12
Vitamin K
Vit. K
Folate
Folate
7%
0%
0%
9.4%
106%
77%
99%
19%
17%
0%
7%
125%
1
100 g
300 g
1 serving fun size bag - 20g 1 serving 2.1 oz bag - 62g
Vitamin C
Vit. C
Vitamin D
Vit. D
Vitamin A
Vit. A
Vitamin E
Vit. E
Vitamin B1
Vit. B1
Vitamin B2
Vit. B2
Vitamin B3
Vit. B3
Vitamin B5
Vit. B5
Vitamin B6
Vit. B6
Vitamin B12
Vit. B12
Vitamin K
Vit. K
Folate
Folate
224%
0%
0%
0%
0%
0%
0%
0%
0%
0%
0%
0%
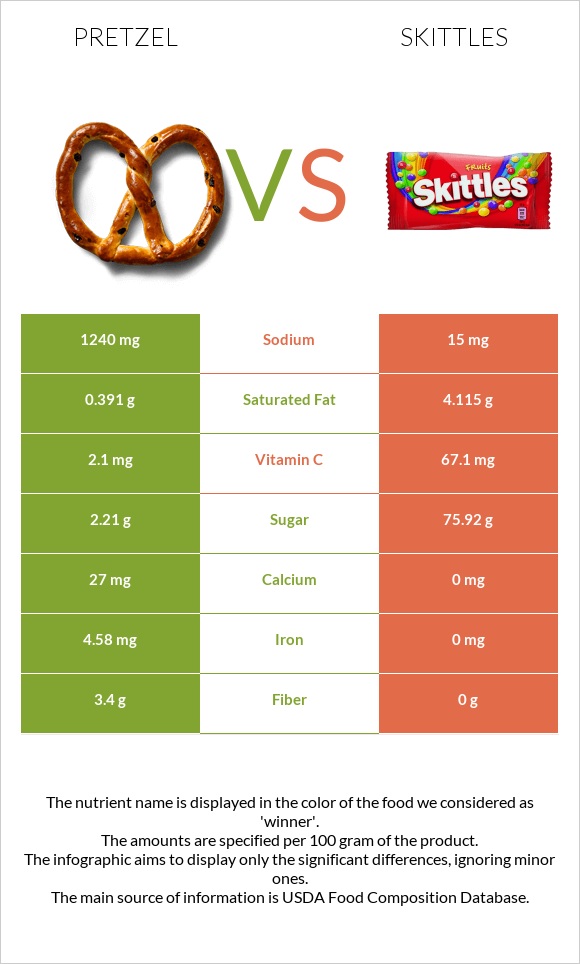
All nutrients comparison - raw data values
Nutrient
DV% diff.
Vitamin C
2.1mg
67.1mg
72%
Iron
4.58mg
0mg
57%
Sodium
1240mg
15mg
53%
Manganese
1.015mg
44%
Folate
166µg
42%
Vitamin B1
0.424mg
35%
Vitamin B3
5.27mg
33%
Starch
72.58g
30%
Vitamin B2
0.332mg
26%
Protein
10.04g
0.19g
20%
Phosphorus
128mg
18%
Copper
0.156mg
17%
Saturated fat
0.391g
4.115g
17%
Fiber
3.4g
0g
14%
Zinc
1.04mg
9%
Polyunsaturated fat
1.291g
9%
Selenium
4.4µg
8%
Magnesium
29mg
7%
Potassium
223mg
7%
Vitamin B5
0.322mg
6%
Vitamin B6
0.074mg
6%
Choline
29.5mg
5%
Carbs
80.39g
90.76g
3%
Calcium
27mg
0mg
3%
Vitamin E
0.47mg
3%
Fats
2.93g
4.25g
2%
Vitamin K
2.8µg
2%
Monounsaturated fat
0.727g
2%
Calories
384kcal
402kcal
1%
Protein per 100 calories
2.6g
0.05g
N/A
Calories per 10 g protein
382kcal
21158kcal
N/A
Weight per 100 calories
26g
25g
N/A
Unsaturated / Saturated Fat ratio
5.2
0
N/A
Net carbs
76.99g
90.76g
N/A
Sugar
2.21g
75.92g
N/A
Trans fat
0.004g
0.074g
N/A
Tryptophan
0.097mg
0%
Threonine
0.25mg
0%
Isoleucine
0.407mg
0%
Leucine
0.757mg
0%
Lysine
0.257mg
0%
Methionine
0.177mg
0%
Phenylalanine
0.52mg
0%
Valine
0.48mg
0%
Histidine
0.22mg
0%
Fructose
0.31g
0%
Omega-3 - ALA
0.063g
N/A
Omega-6 - Gamma-linoleic acid
0.001g
N/A
Omega-6 - Linoleic acid
1.223g
N/A
Macronutrient Comparison
Macronutrient breakdown side-by-side comparison
2
10%
3%
80%
3%
4%
Protein:
10.04 g
Fats:
2.93 g
Carbs:
80.39 g
Water:
3.13 g
Other:
3.51 g
3
4%
91%
4%
Protein:
0.19 g
Fats:
4.25 g
Carbs:
90.76 g
Water:
3.83 g
Other:
0.97 g
Contains
more
Protein Protein
+5184.2%
Contains
more
Other Other
+261.9%
Contains
more
Fats Fats
+45.1%
Contains
more
Carbs Carbs
+12.9%
Contains
more
Water Water
+22.4%
Fat Type Comparison
Fat type breakdown side-by-side comparison
3
16%
30%
54%
Saturated fat:
Sat. Fat
0.391 g
Monounsaturated fat:
Mono. Fat
0.727 g
Polyunsaturated fat:
Poly. Fat
1.291 g
0
100%
Saturated fat:
Sat. Fat
4.115 g
Monounsaturated fat:
Mono. Fat
0 g
Polyunsaturated fat:
Poly. Fat
0 g
Contains
less
Sat. Fat Saturated fat
-90.5%
Contains
more
Mono. Fat Monounsaturated fat
+∞%
Contains
more
Poly. Fat Polyunsaturated fat
+∞%