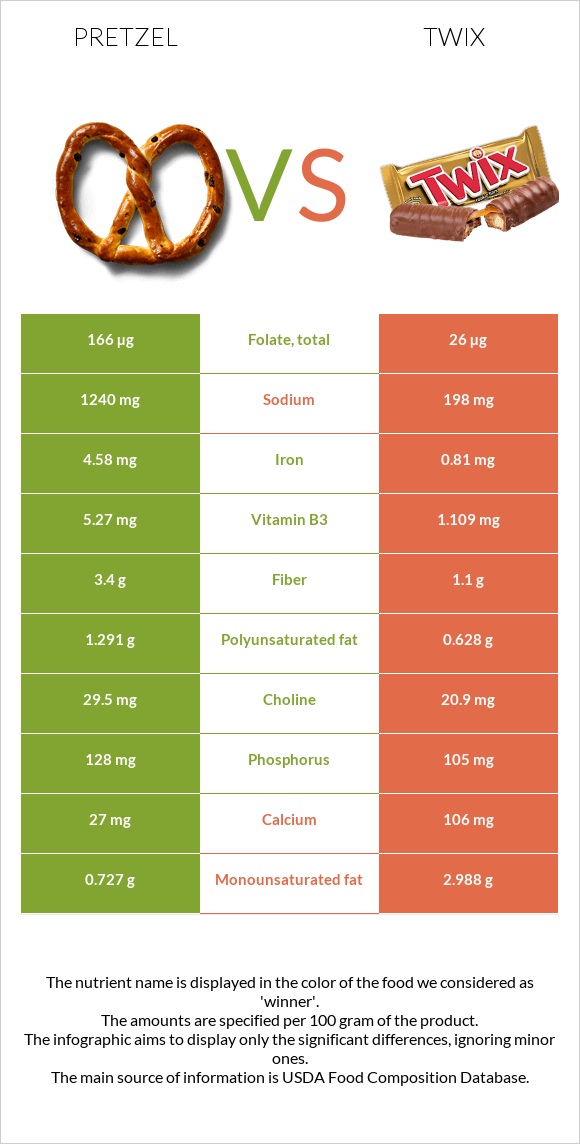
What are the differences between pretzel and Twix? Pretzel is higher in iron, folate, manganese, vitamin B3, vitamin B1, vitamin B2, and fiber, yet Twix is higher in vitamin B12. Twix's daily need coverage for saturated fat is 93% more. Pretzel has 6 times more folate than Twix. While pretzel has 166µg of folate, Twix has only 26µg. The amount of sodium in Twix is lower. The glycemic index of Twix is lower. We used Snacks, pretzels, hard, plain, salted and Candies, MARS SNACKFOOD US, TWIX Caramel Cookie Bars types in this article.
Infographic
Mineral Comparison
Mineral comparison score is based on the number of minerals by which one or the other food is richer. The "coverage" charts below show how much of the daily needs can be covered by 300 grams of the food.
4
100 g
300 g
1 oz - 28.35g 10 twists - 60g
Magnesium
Magnesium
Calcium
Calcium
Potassium
Potassium
Iron
Iron
Copper
Copper
Zinc
Zinc
Phosphorus
Phosphorus
Sodium
Sodium
Manganese
Manganese
Selenium
Selenium
21%
8.1%
20%
172%
52%
28%
55%
162%
132%
24%
3
100 g
300 g
1 package (2 oz) - 57g 1 package (2.06 oz, 2 bars) - 58g 1 package, king size (3.35 oz, 4 bars) - 95g 1 package (11 oz) - 312g
Magnesium
Magnesium
Calcium
Calcium
Potassium
Potassium
Iron
Iron
Copper
Copper
Zinc
Zinc
Phosphorus
Phosphorus
Sodium
Sodium
Manganese
Manganese
Selenium
Selenium
19%
32%
16%
30%
66%
29%
45%
26%
36%
23%
Vitamin Comparison
Vitamin comparison score is based on the number of vitamins by which one or the other food is richer. The "coverage" charts below show how much of the daily needs can be covered by 300 grams of the food.
7
100 g
300 g
1 oz - 28.35g 10 twists - 60g
Vitamin C
Vit. C
Vitamin D
Vit. D
Vitamin A
Vit. A
Vitamin E
Vit. E
Vitamin B1
Vit. B1
Vitamin B2
Vit. B2
Vitamin B3
Vit. B3
Vitamin B5
Vit. B5
Vitamin B6
Vit. B6
Vitamin B12
Vit. B12
Vitamin K
Vit. K
Folate
Folate
7%
0%
0%
9.4%
106%
77%
99%
19%
17%
0%
7%
125%
4
100 g
300 g
1 package (2 oz) - 57g 1 package (2.06 oz, 2 bars) - 58g 1 package, king size (3.35 oz, 4 bars) - 95g 1 package (11 oz) - 312g
Vitamin C
Vit. C
Vitamin D
Vit. D
Vitamin A
Vit. A
Vitamin E
Vit. E
Vitamin B1
Vit. B1
Vitamin B2
Vit. B2
Vitamin B3
Vit. B3
Vitamin B5
Vit. B5
Vitamin B6
Vit. B6
Vitamin B12
Vit. B12
Vitamin K
Vit. K
Folate
Folate
2%
0%
6.7%
15%
39%
48%
21%
16%
5.8%
41%
14%
20%
All nutrients comparison - raw data values
Nutrient
DV% diff.
Saturated fat
0.391g
18.96g
84%
Iron
4.58mg
0.81mg
47%
Sodium
1240mg
198mg
45%
Folate
166µg
26µg
35%
Fats
2.93g
24.85g
34%
Manganese
1.015mg
0.273mg
32%
Starch
72.58g
30%
Vitamin B3
5.27mg
1.109mg
26%
Vitamin B1
0.424mg
0.155mg
22%
Vitamin B12
0µg
0.33µg
14%
Protein
10.04g
4.91g
10%
Vitamin B2
0.332mg
0.208mg
10%
Fiber
3.4g
1.1g
9%
Calcium
27mg
106mg
8%
Calories
384kcal
502kcal
6%
Monounsaturated fat
0.727g
2.988g
6%
Carbs
80.39g
64.8g
5%
Copper
0.156mg
0.197mg
5%
Vitamin B6
0.074mg
0.025mg
4%
Polyunsaturated fat
1.291g
0.628g
4%
Phosphorus
128mg
105mg
3%
Vitamin C
2.1mg
0.6mg
2%
Cholesterol
0mg
7mg
2%
Vitamin A
0µg
20µg
2%
Vitamin E
0.47mg
0.74mg
2%
Vitamin K
2.8µg
5.6µg
2%
Choline
29.5mg
20.9mg
2%
Caffeine
0mg
7mg
2%
Potassium
223mg
186mg
1%
Vitamin B5
0.322mg
0.265mg
1%
Protein per 100 calories
2.6g
0.98g
N/A
Calories per 10 g protein
382kcal
1022kcal
N/A
Weight per 100 calories
26g
20g
N/A
Unsaturated / Saturated Fat ratio
5.2
0.19
N/A
Net carbs
76.99g
63.7g
N/A
Magnesium
29mg
27mg
0%
Sugar
2.21g
48.25g
N/A
Zinc
1.04mg
1.06mg
0%
Selenium
4.4µg
4.3µg
0%
Trans fat
0.004g
0.342g
N/A
Tryptophan
0.097mg
0%
Threonine
0.25mg
0%
Isoleucine
0.407mg
0%
Leucine
0.757mg
0%
Lysine
0.257mg
0%
Methionine
0.177mg
0%
Phenylalanine
0.52mg
0%
Valine
0.48mg
0%
Histidine
0.22mg
0%
Fructose
0.31g
0%
Omega-3 - ALA
0.063g
N/A
Omega-6 - Gamma-linoleic acid
0.001g
N/A
Omega-6 - Linoleic acid
1.223g
N/A
Macronutrient Comparison
Macronutrient breakdown side-by-side comparison
3
10%
3%
80%
3%
4%
Protein:
10.04 g
Fats:
2.93 g
Carbs:
80.39 g
Water:
3.13 g
Other:
3.51 g
2
5%
25%
65%
4%
Protein:
4.91 g
Fats:
24.85 g
Carbs:
64.8 g
Water:
4.23 g
Other:
1.21 g
Contains
more
Protein Protein
+104.5%
Contains
more
Carbs Carbs
+24.1%
Contains
more
Other Other
+190.1%
Contains
more
Fats Fats
+748.1%
Contains
more
Water Water
+35.1%
Fat Type Comparison
Fat type breakdown side-by-side comparison
2
16%
30%
54%
Saturated fat:
Sat. Fat
0.391 g
Monounsaturated fat:
Mono. Fat
0.727 g
Polyunsaturated fat:
Poly. Fat
1.291 g
1
84%
13%
3%
Saturated fat:
Sat. Fat
18.96 g
Monounsaturated fat:
Mono. Fat
2.988 g
Polyunsaturated fat:
Poly. Fat
0.628 g
Contains
less
Sat. Fat Saturated fat
-97.9%
Contains
more
Poly. Fat Polyunsaturated fat
+105.6%
Contains
more
Mono. Fat Monounsaturated fat
+311%