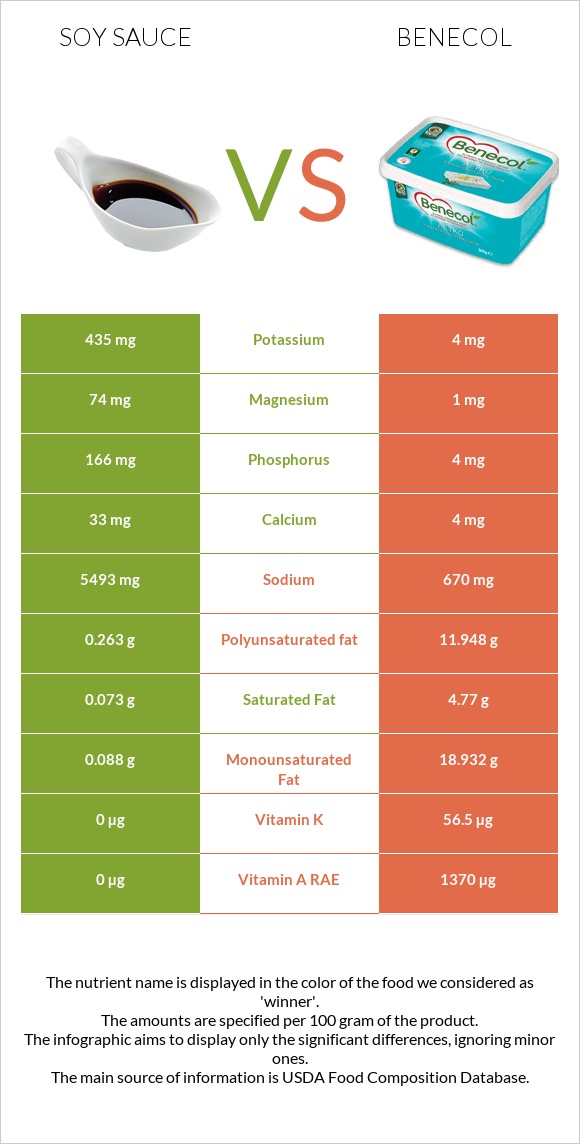
Significant differences between soy sauce and benecol Soy sauce has more manganese, phosphorus, iron, magnesium, and vitamin B3; however, benecol is richer in vitamin E, vitamin A, and vitamin K. Benecol covers your daily vitamin E needs 248% more than soy sauce. Benecol contains less sodium. Specific food types used in this comparison are Soy sauce made from soy and wheat (shoyu) and Margarine-like spread, BENECOL Light Spread .
Infographic
Mineral Comparison
Mineral comparison score is based on the number of minerals by which one or the other food is richer. The "coverage" charts below show how much of the daily needs can be covered by 300 grams of the food.
9
100 g
300 g
1 tsp - 5.3g 1 individual packet - 8.9g 1 tbsp - 16g 1 cup - 255g
Magnesium
Magnesium
Calcium
Calcium
Potassium
Potassium
Iron
Iron
Copper
Copper
Zinc
Zinc
Phosphorus
Phosphorus
Sodium
Sodium
Manganese
Manganese
Selenium
Selenium
53%
9.9%
38%
54%
14%
24%
71%
716%
133%
2.7%
1
100 g
300 g
1 tablespoon (1 NLEA serving) - 14g
Magnesium
Magnesium
Calcium
Calcium
Potassium
Potassium
Iron
Iron
Copper
Copper
Zinc
Zinc
Phosphorus
Phosphorus
Sodium
Sodium
Manganese
Manganese
Selenium
Selenium
0.71%
1.2%
0.35%
0%
0%
0%
1.7%
87%
0%
0%
Vitamin Comparison
Vitamin comparison score is based on the number of vitamins by which one or the other food is richer. The "coverage" charts below show how much of the daily needs can be covered by 300 grams of the food.
6
100 g
300 g
1 tsp - 5.3g 1 individual packet - 8.9g 1 tbsp - 16g 1 cup - 255g
Vitamin C
Vit. C
Vitamin D
Vit. D
Vitamin A
Vit. A
Vitamin E
Vit. E
Vitamin B1
Vit. B1
Vitamin B2
Vit. B2
Vitamin B3
Vit. B3
Vitamin B5
Vit. B5
Vitamin B6
Vit. B6
Vitamin B12
Vit. B12
Vitamin K
Vit. K
Folate
Folate
0%
0%
0%
0%
8.3%
38%
41%
18%
34%
0%
0%
11%
3
100 g
300 g
1 tablespoon (1 NLEA serving) - 14g
Vitamin C
Vit. C
Vitamin D
Vit. D
Vitamin A
Vit. A
Vitamin E
Vit. E
Vitamin B1
Vit. B1
Vitamin B2
Vit. B2
Vitamin B3
Vit. B3
Vitamin B5
Vit. B5
Vitamin B6
Vit. B6
Vitamin B12
Vit. B12
Vitamin K
Vit. K
Folate
Folate
0%
0%
457%
744%
3%
0%
0%
0%
0%
0%
141%
0%
All nutrients comparison - raw data values
Nutrient
DV% diff.
Vitamin E
0mg
37.22mg
248%
Sodium
5493mg
670mg
210%
Vitamin A
0µg
1370µg
152%
Polyunsaturated fat
0.263g
11.948g
78%
Fats
0.57g
38.71g
59%
Vitamin K
0µg
56.5µg
47%
Monounsaturated fat
0.088g
18.932g
47%
Manganese
1.018mg
0mg
44%
Phosphorus
166mg
4mg
23%
Saturated fat
0.073g
4.77g
21%
Iron
1.45mg
0mg
18%
Magnesium
74mg
1mg
17%
Protein
8.14g
0g
16%
Calories
53kcal
357kcal
15%
Vitamin B3
2.196mg
0mg
14%
Potassium
435mg
4mg
13%
Vitamin B2
0.165mg
0mg
13%
Vitamin B6
0.148mg
0mg
11%
Zinc
0.87mg
0mg
8%
Vitamin B5
0.297mg
6%
Copper
0.043mg
0mg
5%
Folate
14µg
4%
Calcium
33mg
4mg
3%
Fiber
0.8g
3%
Choline
18.3mg
3%
Vitamin B1
0.033mg
0.012mg
2%
Selenium
0.5µg
1%
Protein per 100 calories
15g
0g
N/A
Calories per 10 g protein
65kcal
N/A
Weight per 100 calories
189g
28g
N/A
Unsaturated / Saturated Fat ratio
4.8
6.5
N/A
Net carbs
4.13g
5.71g
N/A
Carbs
4.93g
5.71g
0%
Sugar
0.4g
N/A
Trans fat
0g
2.214g
N/A
Tryptophan
0.096mg
0%
Threonine
0.271mg
0%
Isoleucine
0.318mg
0%
Leucine
0.537mg
0%
Lysine
0.381mg
0%
Methionine
0.097mg
0%
Phenylalanine
0.353mg
0%
Valine
0.332mg
0%
Histidine
0.174mg
0%
Omega-3 - ALA
1.976g
N/A
Omega-6 - Eicosadienoic acid
0.037g
N/A
Omega-6 - Linoleic acid
9.557g
N/A
Macronutrient Comparison
Macronutrient breakdown side-by-side comparison
3
8%
5%
71%
15%
Protein:
8.14 g
Fats:
0.57 g
Carbs:
4.93 g
Water:
71.15 g
Other:
15.21 g
2
39%
6%
54%
2%
Protein:
0 g
Fats:
38.71 g
Carbs:
5.71 g
Water:
53.73 g
Other:
1.85 g
Contains
more
Protein Protein
+∞%
Contains
more
Water Water
+32.4%
Contains
more
Other Other
+722.2%
Contains
more
Fats Fats
+6691.2%
Contains
more
Carbs Carbs
+15.8%
Fat Type Comparison
Fat type breakdown side-by-side comparison
1
17%
21%
62%
Saturated fat:
Sat. Fat
0.073 g
Monounsaturated fat:
Mono. Fat
0.088 g
Polyunsaturated fat:
Poly. Fat
0.263 g
2
13%
53%
34%
Saturated fat:
Sat. Fat
4.77 g
Monounsaturated fat:
Mono. Fat
18.932 g
Polyunsaturated fat:
Poly. Fat
11.948 g
Contains
less
Sat. Fat Saturated fat
-98.5%
Contains
more
Mono. Fat Monounsaturated fat
+21413.6%
Contains
more
Poly. Fat Polyunsaturated fat
+4443%