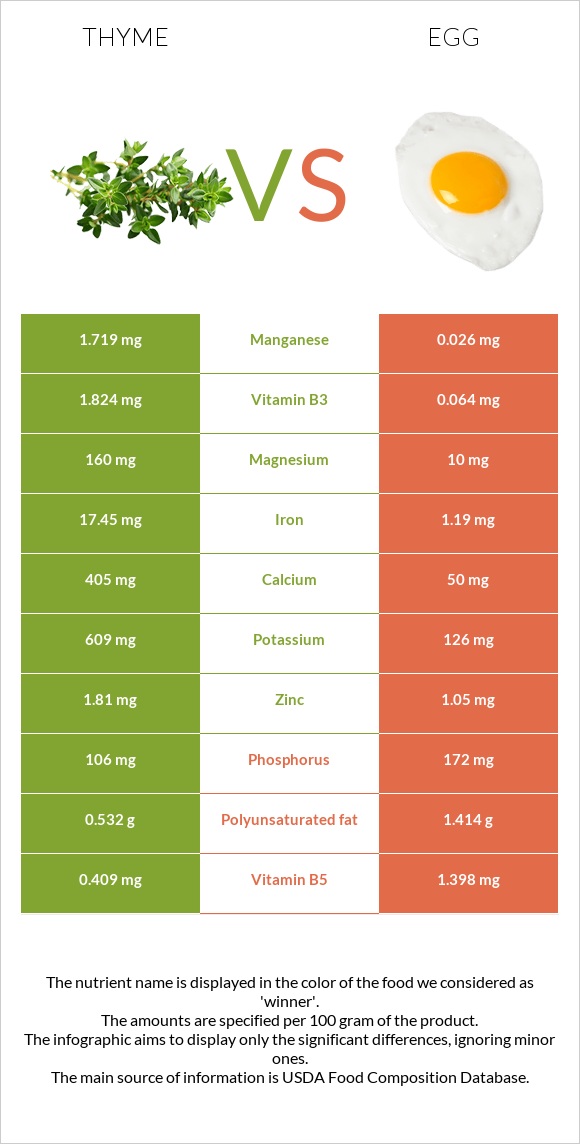
How are thyme and eggs different? Thyme has more iron, vitamin C, vitamin A, manganese, fiber, magnesium, and calcium; however, eggs are richer in copper and vitamin B12. Thyme covers your daily need for iron, 203% more than eggs. Thyme has a higher glycemic index. The glycemic index of thyme is 45, while the glycemic index of eggs is 0. Thyme, fresh and Egg, whole, cooked, hard-boiled types were used in this article.
Infographic
Mineral Comparison
Mineral comparison score is based on the number of minerals by which one or the other food is richer. The "coverage" charts below show how much of the daily needs can be covered by 300 grams of the food.
7
100 g
300 g
0.5 tsp - 0.4g 1 tsp - 0.8g
Magnesium
Magnesium
Calcium
Calcium
Potassium
Potassium
Iron
Iron
Copper
Copper
Zinc
Zinc
Phosphorus
Phosphorus
Sodium
Sodium
Manganese
Manganese
Selenium
Selenium
114%
122%
54%
654%
185%
49%
45%
1.2%
224%
0%
3
100 g
300 g
1 tbsp - 8.5g 1 large - 50g 1 cup, chopped - 136g
Magnesium
Magnesium
Calcium
Calcium
Potassium
Potassium
Iron
Iron
Copper
Copper
Zinc
Zinc
Phosphorus
Phosphorus
Sodium
Sodium
Manganese
Manganese
Selenium
Selenium
7.1%
15%
11%
45%
667%
29%
74%
16%
3.4%
168%
Vitamin Comparison
Vitamin comparison score is based on the number of vitamins by which one or the other food is richer. The "coverage" charts below show how much of the daily needs can be covered by 300 grams of the food.
4
100 g
300 g
0.5 tsp - 0.4g 1 tsp - 0.8g
Vitamin C
Vit. C
Vitamin D
Vit. D
Vitamin A
Vit. A
Vitamin E
Vit. E
Vitamin B1
Vit. B1
Vitamin B2
Vit. B2
Vitamin B3
Vit. B3
Vitamin B5
Vit. B5
Vitamin B6
Vit. B6
Vitamin B12
Vit. B12
Vitamin K
Vit. K
Folate
Folate
534%
0%
79%
0%
12%
109%
34%
25%
80%
0%
0%
34%
6
100 g
300 g
1 tbsp - 8.5g 1 large - 50g 1 cup, chopped - 136g
Vitamin C
Vit. C
Vitamin D
Vit. D
Vitamin A
Vit. A
Vitamin E
Vit. E
Vitamin B1
Vit. B1
Vitamin B2
Vit. B2
Vitamin B3
Vit. B3
Vitamin B5
Vit. B5
Vitamin B6
Vit. B6
Vitamin B12
Vit. B12
Vitamin K
Vit. K
Folate
Folate
0%
33%
50%
21%
17%
118%
1.2%
84%
28%
139%
0.75%
33%
All nutrients comparison - raw data values
Nutrient
DV% diff.
Iron
17.45mg
1.19mg
203%
Vitamin C
160.1mg
0mg
178%
Copper
0.555mg
2mg
161%
Cholesterol
0mg
373mg
124%
Manganese
1.719mg
0.026mg
74%
Fiber
14g
0g
56%
Selenium
30.8µg
56%
Choline
293.8mg
53%
Vitamin B12
0µg
1.11µg
46%
Magnesium
160mg
10mg
36%
Calcium
405mg
50mg
36%
Vitamin B5
0.409mg
1.398mg
20%
Vitamin B6
0.348mg
0.121mg
17%
Protein
5.56g
12.58g
14%
Fats
1.68g
10.61g
14%
Potassium
609mg
126mg
14%
Saturated fat
0.467g
3.267g
13%
Vitamin D*
0 IU
87 IU
11%
Vitamin D
0µg
2.2µg
11%
Vitamin B3
1.824mg
0.064mg
11%
Vitamin A
238µg
149µg
10%
Monounsaturated fat
0.081g
4.077g
10%
Phosphorus
106mg
172mg
9%
Carbs
24.45g
1.12g
8%
Zinc
1.81mg
1.05mg
7%
Vitamin E
1.03mg
7%
Polyunsaturated fat
0.532g
1.414g
6%
Sodium
9mg
124mg
5%
Calories
101kcal
155kcal
3%
Vitamin B2
0.471mg
0.513mg
3%
Vitamin B1
0.048mg
0.066mg
2%
Protein per 100 calories
5.5g
8.1g
N/A
Calories per 10 g protein
182kcal
123kcal
N/A
Weight per 100 calories
99g
65g
N/A
Unsaturated / Saturated Fat ratio
1.3
1.7
N/A
Net carbs
10.45g
1.12g
N/A
Sugar
1.12g
N/A
Vitamin K
0.3µg
0%
Folate
45µg
44µg
0%
Tryptophan
0.114mg
0.153mg
0%
Threonine
0.154mg
0.604mg
0%
Isoleucine
0.285mg
0.686mg
0%
Leucine
0.262mg
1.075mg
0%
Lysine
0.126mg
0.904mg
0%
Methionine
0.392mg
0%
Phenylalanine
0.668mg
0%
Valine
0.307mg
0.767mg
0%
Histidine
0.298mg
0%
Omega-3 - EPA
0.005g
N/A
Omega-3 - DHA
0.038g
N/A
Macronutrient Comparison
Macronutrient breakdown side-by-side comparison
2
6%
2%
24%
65%
3%
Protein:
5.56 g
Fats:
1.68 g
Carbs:
24.45 g
Water:
65.11 g
Other:
3.2 g
3
13%
11%
75%
Protein:
12.58 g
Fats:
10.61 g
Carbs:
1.12 g
Water:
74.62 g
Other:
1.07 g
Contains
more
Carbs Carbs
+2083%
Contains
more
Other Other
+199.1%
Contains
more
Protein Protein
+126.3%
Contains
more
Fats Fats
+531.5%
Contains
more
Water Water
+14.6%
Fat Type Comparison
Fat type breakdown side-by-side comparison
1
43%
8%
49%
Saturated fat:
Sat. Fat
0.467 g
Monounsaturated fat:
Mono. Fat
0.081 g
Polyunsaturated fat:
Poly. Fat
0.532 g
2
37%
47%
16%
Saturated fat:
Sat. Fat
3.267 g
Monounsaturated fat:
Mono. Fat
4.077 g
Polyunsaturated fat:
Poly. Fat
1.414 g
Contains
less
Sat. Fat Saturated fat
-85.7%
Contains
more
Mono. Fat Monounsaturated fat
+4933.3%
Contains
more
Poly. Fat Polyunsaturated fat
+165.8%