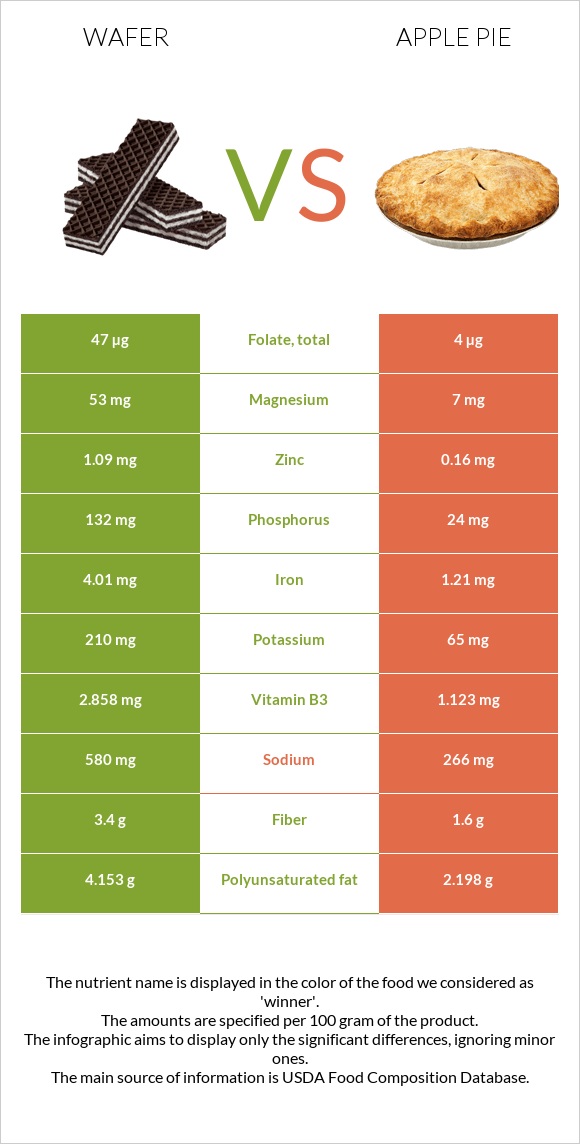
Significant differences between wafer and apple pie The amount of copper, iron, manganese, phosphorus, magnesium, vitamin B3, folate, zinc, and vitamin B2 in wafer is higher than in apple pie. Wafer covers your daily copper needs 46% more than apple pie. Apple pie has 12 times less folate than wafer. Wafer has 47µg of folate, while apple pie has 4µg. Apple pie contains less sodium. Wafer has a higher glycemic index. The glycemic index of wafer is 61, while the glycemic index of apple pie is 41. Specific food types used in this comparison are Cookies, chocolate wafers and Pie, apple, commercially prepared, unenriched flour .
Infographic
Mineral Comparison
Mineral comparison score is based on the number of minerals by which one or the other food is richer. The "coverage" charts below show how much of the daily needs can be covered by 300 grams of the food.
9
100 g
300 g
1 wafer - 6g 1 oz - 28.35g 1 cup, crumbs - 112g
Magnesium
Magnesium
Calcium
Calcium
Potassium
Potassium
Iron
Iron
Copper
Copper
Zinc
Zinc
Phosphorus
Phosphorus
Sodium
Sodium
Manganese
Manganese
Selenium
Selenium
38%
9.3%
19%
150%
154%
30%
57%
76%
91%
31%
1
100 g
300 g
1 oz - 28.35g 1 piece (1/6 of 8" pie) - 117g 1 piece (1/8 of 9" dia) - 125g
Magnesium
Magnesium
Calcium
Calcium
Potassium
Potassium
Iron
Iron
Copper
Copper
Zinc
Zinc
Phosphorus
Phosphorus
Sodium
Sodium
Manganese
Manganese
Selenium
Selenium
5%
3.3%
5.7%
45%
15%
4.4%
10%
35%
24%
0%
Vitamin Comparison
Vitamin comparison score is based on the number of vitamins by which one or the other food is richer. The "coverage" charts below show how much of the daily needs can be covered by 300 grams of the food.
9
100 g
300 g
1 wafer - 6g 1 oz - 28.35g 1 cup, crumbs - 112g
Vitamin C
Vit. C
Vitamin D
Vit. D
Vitamin A
Vit. A
Vitamin E
Vit. E
Vitamin B1
Vit. B1
Vitamin B2
Vit. B2
Vitamin B3
Vit. B3
Vitamin B5
Vit. B5
Vitamin B6
Vit. B6
Vitamin B12
Vit. B12
Vitamin K
Vit. K
Folate
Folate
0%
0%
1%
14%
51%
61%
54%
23%
12%
11%
6%
35%
2
100 g
300 g
1 oz - 28.35g 1 piece (1/6 of 8" pie) - 117g 1 piece (1/8 of 9" dia) - 125g
Vitamin C
Vit. C
Vitamin D
Vit. D
Vitamin A
Vit. A
Vitamin E
Vit. E
Vitamin B1
Vit. B1
Vitamin B2
Vit. B2
Vitamin B3
Vit. B3
Vitamin B5
Vit. B5
Vitamin B6
Vit. B6
Vitamin B12
Vit. B12
Vitamin K
Vit. K
Folate
Folate
11%
0%
9.7%
0%
34%
36%
21%
7.1%
8.8%
1.3%
0%
3%
All nutrients comparison - raw data values
Nutrient
DV% diff.
Copper
0.463mg
0.046mg
46%
Iron
4.01mg
1.21mg
35%
Manganese
0.696mg
0.182mg
22%
Phosphorus
132mg
24mg
15%
Sodium
580mg
266mg
14%
Carbs
72.7g
34g
13%
Polyunsaturated fat
4.153g
2.198g
13%
Magnesium
53mg
7mg
11%
Vitamin B3
2.858mg
1.123mg
11%
Folate
47µg
4µg
11%
Calories
433kcal
237kcal
10%
Selenium
5.7µg
10%
Protein
6.6g
1.9g
9%
Zinc
1.09mg
0.16mg
8%
Vitamin B2
0.266mg
0.158mg
8%
Fiber
3.4g
1.6g
7%
Vitamin B1
0.203mg
0.134mg
6%
Fats
14.2g
11g
5%
Vitamin E
0.72mg
5%
Vitamin B5
0.381mg
0.119mg
5%
Vitamin C
0mg
3.2mg
4%
Potassium
210mg
65mg
4%
Vitamin A
3µg
29µg
3%
Vitamin B12
0.09µg
0.01µg
3%
Choline
14.3mg
3%
Caffeine
10mg
3%
Calcium
31mg
11mg
2%
Vitamin K
2.4µg
2%
Saturated fat
4.241g
3.797g
2%
Cholesterol
2mg
0mg
1%
Vitamin B6
0.051mg
0.038mg
1%
Monounsaturated fat
4.865g
4.388g
1%
Protein per 100 calories
1.5g
0.8g
N/A
Calories per 10 g protein
656kcal
1247kcal
N/A
Weight per 100 calories
23g
42g
N/A
Unsaturated / Saturated Fat ratio
2.1
1.7
N/A
Net carbs
69.3g
32.4g
N/A
Sugar
37.43g
N/A
Tryptophan
0.096mg
0.026mg
0%
Threonine
0.22mg
0.054mg
0%
Isoleucine
0.261mg
0.073mg
0%
Leucine
0.447mg
0.129mg
0%
Lysine
0.281mg
0.07mg
0%
Methionine
0.105mg
0.032mg
0%
Phenylalanine
0.308mg
0.088mg
0%
Valine
0.323mg
0.084mg
0%
Histidine
0.128mg
0.038mg
0%
Omega-3 - EPA
0.003g
N/A
Omega-3 - DHA
0.002g
N/A
Macronutrient Comparison
Macronutrient breakdown side-by-side comparison
4
7%
14%
73%
5%
2%
Protein:
6.6 g
Fats:
14.2 g
Carbs:
72.7 g
Water:
4.5 g
Other:
2 g
1
2%
11%
34%
52%
Protein:
1.9 g
Fats:
11 g
Carbs:
34 g
Water:
52.2 g
Other:
0.9 g
Contains
more
Protein Protein
+247.4%
Contains
more
Fats Fats
+29.1%
Contains
more
Carbs Carbs
+113.8%
Contains
more
Other Other
+122.2%
Contains
more
Water Water
+1060%
Fat Type Comparison
Fat type breakdown side-by-side comparison
2
32%
37%
31%
Saturated fat:
Sat. Fat
4.241 g
Monounsaturated fat:
Mono. Fat
4.865 g
Polyunsaturated fat:
Poly. Fat
4.153 g
1
37%
42%
21%
Saturated fat:
Sat. Fat
3.797 g
Monounsaturated fat:
Mono. Fat
4.388 g
Polyunsaturated fat:
Poly. Fat
2.198 g
Contains
more
Poly. Fat Polyunsaturated fat
+88.9%
Contains
less
Sat. Fat Saturated fat
-10.5%
~equal in
Monounsaturated fat
~4.388g