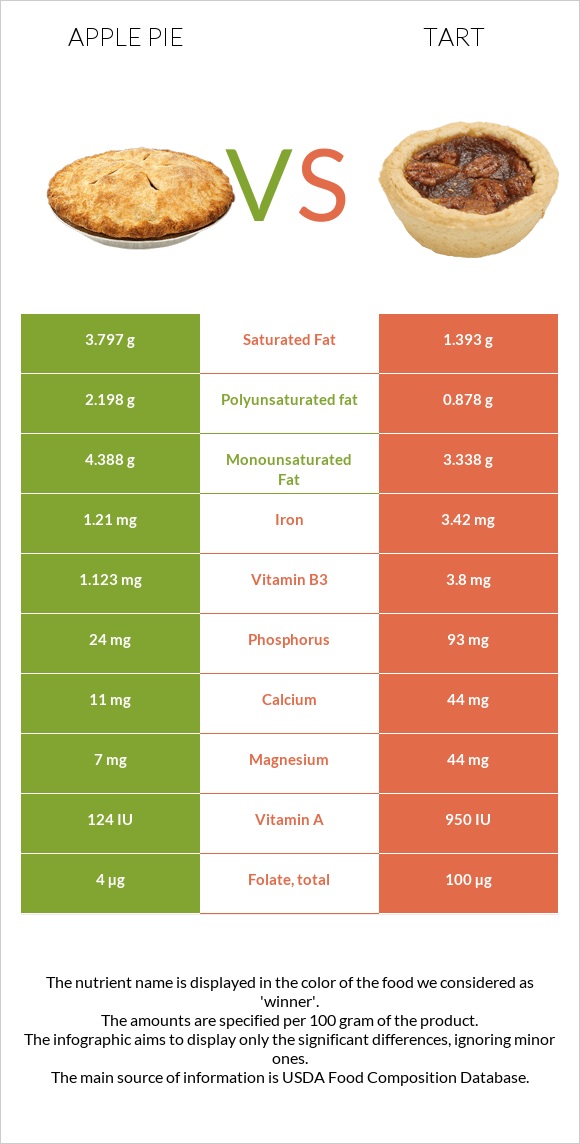
Important differences between apple pie and tart Apple pie has less vitamin B2, iron, vitamin B6, folate, vitamin B3, vitamin A, vitamin B1, phosphorus, and magnesium. Tart's daily need coverage for vitamin B2 is 30% more. Apple pie has 3 times more saturated fat than tart. Apple pie has 3.797g of saturated fat, while tart has 1.393g. The food varieties used in the comparison are Pie, apple, commercially prepared, unenriched flour and Breakfast tart, low fat .
Infographic
Mineral Comparison
Mineral comparison score is based on the number of minerals by which one or the other food is richer. The "coverage" charts below show how much of the daily needs can be covered by 300 grams of the food.
2
100 g
300 g
1 oz - 28.35g 1 piece (1/6 of 8" pie) - 117g 1 piece (1/8 of 9" dia) - 125g
Magnesium
Magnesium
Calcium
Calcium
Potassium
Potassium
Iron
Iron
Copper
Copper
Zinc
Zinc
Phosphorus
Phosphorus
Sodium
Sodium
Manganese
Manganese
Selenium
Selenium
5%
3.3%
5.7%
45%
15%
4.4%
10%
35%
24%
0%
7
100 g
300 g
1 tart - 52g
Magnesium
Magnesium
Calcium
Calcium
Potassium
Potassium
Iron
Iron
Copper
Copper
Zinc
Zinc
Phosphorus
Phosphorus
Sodium
Sodium
Manganese
Manganese
Selenium
Selenium
31%
13%
5.8%
128%
24%
7.6%
40%
47%
0%
70%
Vitamin Comparison
Vitamin comparison score is based on the number of vitamins by which one or the other food is richer. The "coverage" charts below show how much of the daily needs can be covered by 300 grams of the food.
2
100 g
300 g
1 oz - 28.35g 1 piece (1/6 of 8" pie) - 117g 1 piece (1/8 of 9" dia) - 125g
Vitamin C
Vit. C
Vitamin D
Vit. D
Vitamin A
Vit. A
Vitamin E
Vit. E
Vitamin B1
Vit. B1
Vitamin B2
Vit. B2
Vitamin B3
Vit. B3
Vitamin B5
Vit. B5
Vitamin B6
Vit. B6
Vitamin B12
Vit. B12
Vitamin K
Vit. K
Folate
Folate
11%
0%
9.7%
0%
34%
36%
21%
7.1%
8.8%
1.3%
0%
3%
9
100 g
300 g
1 tart - 52g
Vitamin C
Vit. C
Vitamin D
Vit. D
Vitamin A
Vit. A
Vitamin E
Vit. E
Vitamin B1
Vit. B1
Vitamin B2
Vit. B2
Vitamin B3
Vit. B3
Vitamin B5
Vit. B5
Vitamin B6
Vit. B6
Vitamin B12
Vit. B12
Vitamin K
Vit. K
Folate
Folate
13%
0%
95%
11%
71%
127%
71%
0%
88%
0%
1%
75%
All nutrients comparison - raw data values
Nutrient
DV% diff.
Vitamin B2
0.158mg
0.549mg
30%
Iron
1.21mg
3.42mg
28%
Vitamin A
29µg
285µg
28%
Vitamin B6
0.038mg
0.38mg
26%
Folate
4µg
100µg
24%
Selenium
12.9µg
23%
Vitamin B3
1.123mg
3.8mg
17%
Carbs
34g
76.8g
14%
Vitamin B1
0.134mg
0.285mg
13%
Saturated fat
3.797g
1.393g
11%
Phosphorus
24mg
93mg
10%
Magnesium
7mg
44mg
9%
Polyunsaturated fat
2.198g
0.878g
9%
Fats
11g
5.99g
8%
Manganese
0.182mg
8%
Calories
237kcal
372kcal
7%
Protein
1.9g
3.99g
4%
Sodium
266mg
361mg
4%
Vitamin E
0.53mg
4%
Calcium
11mg
44mg
3%
Copper
0.046mg
0.073mg
3%
Monounsaturated fat
4.388g
3.338g
3%
Vitamin B5
0.119mg
2%
Choline
8.4mg
2%
Vitamin C
3.2mg
3.8mg
1%
Zinc
0.16mg
0.28mg
1%
Protein per 100 calories
0.8g
1.1g
N/A
Calories per 10 g protein
1247kcal
932kcal
N/A
Weight per 100 calories
42g
27g
N/A
Unsaturated / Saturated Fat ratio
1.7
3
N/A
Net carbs
32.4g
75.3g
N/A
Potassium
65mg
66mg
0%
Sugar
4.87g
N/A
Fiber
1.6g
1.5g
0%
Vitamin B12
0.01µg
0µg
0%
Vitamin K
0.4µg
0%
Tryptophan
0.026mg
0%
Threonine
0.054mg
0%
Isoleucine
0.073mg
0%
Leucine
0.129mg
0%
Lysine
0.07mg
0%
Methionine
0.032mg
0%
Phenylalanine
0.088mg
0%
Valine
0.084mg
0%
Histidine
0.038mg
0%
Macronutrient Comparison
Macronutrient breakdown side-by-side comparison
2
2%
11%
34%
52%
Protein:
1.9 g
Fats:
11 g
Carbs:
34 g
Water:
52.2 g
Other:
0.9 g
3
4%
6%
77%
12%
Protein:
3.99 g
Fats:
5.99 g
Carbs:
76.8 g
Water:
12.04 g
Other:
1.18 g
Contains
more
Fats Fats
+83.6%
Contains
more
Water Water
+333.6%
Contains
more
Protein Protein
+110%
Contains
more
Carbs Carbs
+125.9%
Contains
more
Other Other
+31.1%
Fat Type Comparison
Fat type breakdown side-by-side comparison
2
37%
42%
21%
Saturated fat:
Sat. Fat
3.797 g
Monounsaturated fat:
Mono. Fat
4.388 g
Polyunsaturated fat:
Poly. Fat
2.198 g
1
25%
60%
16%
Saturated fat:
Sat. Fat
1.393 g
Monounsaturated fat:
Mono. Fat
3.338 g
Polyunsaturated fat:
Poly. Fat
0.878 g
Contains
more
Mono. Fat Monounsaturated fat
+31.5%
Contains
more
Poly. Fat Polyunsaturated fat
+150.3%
Contains
less
Sat. Fat Saturated fat
-63.3%