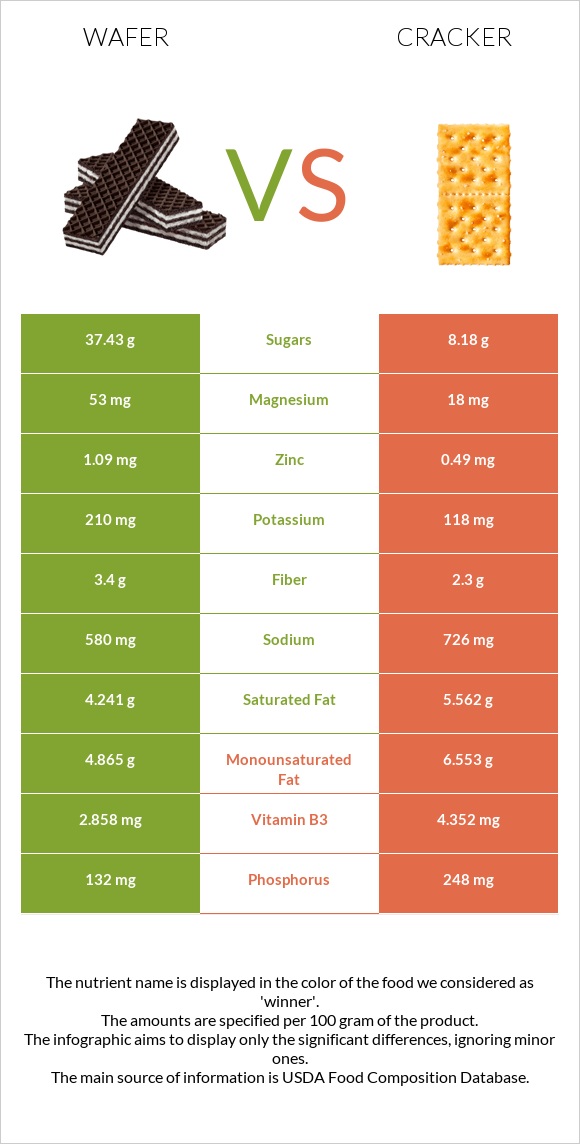
What are the main differences between wafer and crackers? Wafer is richer in copper and manganese, while crackers are higher in vitamin K, vitamin B1, phosphorus, vitamin E, vitamin B2, folate, vitamin B3, and calcium. Crackers' daily need coverage for vitamin K is 56% higher. Crackers have 4 times less copper than wafer. Wafer has 0.463mg of copper, while crackers have 0.104mg. We used Cookies, chocolate wafers and Crackers, standard snack-type, regular types in this comparison.
Infographic
Mineral Comparison
Mineral comparison score is based on the number of minerals by which one or the other food is richer. The "coverage" charts below show how much of the daily needs can be covered by 300 grams of the food.
6
100 g
300 g
1 wafer - 6g 1 oz - 28.35g 1 cup, crumbs - 112g
Magnesium
Magnesium
Calcium
Calcium
Potassium
Potassium
Iron
Iron
Copper
Copper
Zinc
Zinc
Phosphorus
Phosphorus
Sodium
Sodium
Manganese
Manganese
Selenium
Selenium
38%
9.3%
19%
150%
154%
30%
57%
76%
91%
31%
3
100 g
300 g
1 cracker, round - 3.2g 1 cracker, rectangular - 4g 5 crackers - 16g 5 crackers, regular size, round (1 serving) - 16g 1 cup crushed - 52g
Magnesium
Magnesium
Calcium
Calcium
Potassium
Potassium
Iron
Iron
Copper
Copper
Zinc
Zinc
Phosphorus
Phosphorus
Sodium
Sodium
Manganese
Manganese
Selenium
Selenium
13%
36%
10%
151%
35%
13%
106%
95%
64%
37%
Vitamin Comparison
Vitamin comparison score is based on the number of vitamins by which one or the other food is richer. The "coverage" charts below show how much of the daily needs can be covered by 300 grams of the food.
2
100 g
300 g
1 wafer - 6g 1 oz - 28.35g 1 cup, crumbs - 112g
Vitamin C
Vit. C
Vitamin D
Vit. D
Vitamin A
Vit. A
Vitamin E
Vit. E
Vitamin B1
Vit. B1
Vitamin B2
Vit. B2
Vitamin B3
Vit. B3
Vitamin B5
Vit. B5
Vitamin B6
Vit. B6
Vitamin B12
Vit. B12
Vitamin K
Vit. K
Folate
Folate
0%
0%
1%
14%
51%
61%
54%
23%
12%
11%
6%
35%
7
100 g
300 g
1 cracker, round - 3.2g 1 cracker, rectangular - 4g 5 crackers - 16g 5 crackers, regular size, round (1 serving) - 16g 1 cup crushed - 52g
Vitamin C
Vit. C
Vitamin D
Vit. D
Vitamin A
Vit. A
Vitamin E
Vit. E
Vitamin B1
Vit. B1
Vitamin B2
Vit. B2
Vitamin B3
Vit. B3
Vitamin B5
Vit. B5
Vitamin B6
Vit. B6
Vitamin B12
Vit. B12
Vitamin K
Vit. K
Folate
Folate
0%
0%
0%
61%
104%
105%
82%
25%
15%
0%
173%
69%
All nutrients comparison - raw data values
Nutrient
DV% diff.
Polyunsaturated fat
4.153g
13.137g
60%
Vitamin K
2.4µg
69.3µg
56%
Copper
0.463mg
0.104mg
40%
Starch
49.69g
20%
Fats
14.2g
26.43g
19%
Vitamin B1
0.203mg
0.416mg
18%
Phosphorus
132mg
248mg
17%
Vitamin E
0.72mg
3.03mg
15%
Vitamin B2
0.266mg
0.456mg
15%
Folate
47µg
92µg
11%
Calcium
31mg
120mg
9%
Manganese
0.696mg
0.491mg
9%
Vitamin B3
2.858mg
4.352mg
9%
Magnesium
53mg
18mg
8%
Sodium
580mg
726mg
6%
Saturated fat
4.241g
5.562g
6%
Zinc
1.09mg
0.49mg
5%
Calories
433kcal
510kcal
4%
Carbs
72.7g
61.3g
4%
Fiber
3.4g
2.3g
4%
Vitamin B12
0.09µg
0µg
4%
Monounsaturated fat
4.865g
6.553g
4%
Potassium
210mg
118mg
3%
Caffeine
10mg
0mg
3%
Selenium
5.7µg
6.7µg
2%
Cholesterol
2mg
0mg
1%
Vitamin B5
0.381mg
0.417mg
1%
Vitamin B6
0.051mg
0.063mg
1%
Choline
14.3mg
9.6mg
1%
Protein
6.6g
6.64g
0%
Protein per 100 calories
1.5g
1.3g
N/A
Calories per 10 g protein
656kcal
768kcal
N/A
Weight per 100 calories
23g
20g
N/A
Unsaturated / Saturated Fat ratio
2.1
3.5
N/A
Net carbs
69.3g
59g
N/A
Iron
4.01mg
4.03mg
0%
Sugar
37.43g
8.18g
N/A
Vitamin A
3µg
0µg
0%
Trans fat
1.076g
N/A
Tryptophan
0.096mg
0.084mg
0%
Threonine
0.22mg
0.193mg
0%
Isoleucine
0.261mg
0.246mg
0%
Leucine
0.447mg
0.471mg
0%
Lysine
0.281mg
0.103mg
0%
Methionine
0.105mg
0.112mg
0%
Phenylalanine
0.308mg
0.331mg
0%
Valine
0.323mg
0.294mg
0%
Histidine
0.128mg
0.145mg
0%
Fructose
0.29g
0%
Omega-3 - EPA
0.003g
0g
N/A
Omega-3 - DHA
0.002g
0g
N/A
Omega-3 - ALA
1.485g
N/A
Omega-6 - Gamma-linoleic acid
0.062g
N/A
Omega-6 - Eicosadienoic acid
0.009g
N/A
Omega-6 - Linoleic acid
11.48g
N/A
Macronutrient Comparison
Macronutrient breakdown side-by-side comparison
2
7%
14%
73%
5%
2%
Protein:
6.6 g
Fats:
14.2 g
Carbs:
72.7 g
Water:
4.5 g
Other:
2 g
3
7%
26%
61%
3%
2%
Protein:
6.64 g
Fats:
26.43 g
Carbs:
61.3 g
Water:
3.14 g
Other:
2.49 g
Contains
more
Carbs Carbs
+18.6%
Contains
more
Water Water
+43.3%
Contains
more
Fats Fats
+86.1%
Contains
more
Other Other
+24.5%
Fat Type Comparison
Fat type breakdown side-by-side comparison
1
32%
37%
31%
Saturated fat:
Sat. Fat
4.241 g
Monounsaturated fat:
Mono. Fat
4.865 g
Polyunsaturated fat:
Poly. Fat
4.153 g
2
22%
26%
52%
Saturated fat:
Sat. Fat
5.562 g
Monounsaturated fat:
Mono. Fat
6.553 g
Polyunsaturated fat:
Poly. Fat
13.137 g
Contains
less
Sat. Fat Saturated fat
-23.8%
Contains
more
Mono. Fat Monounsaturated fat
+34.7%
Contains
more
Poly. Fat Polyunsaturated fat
+216.3%