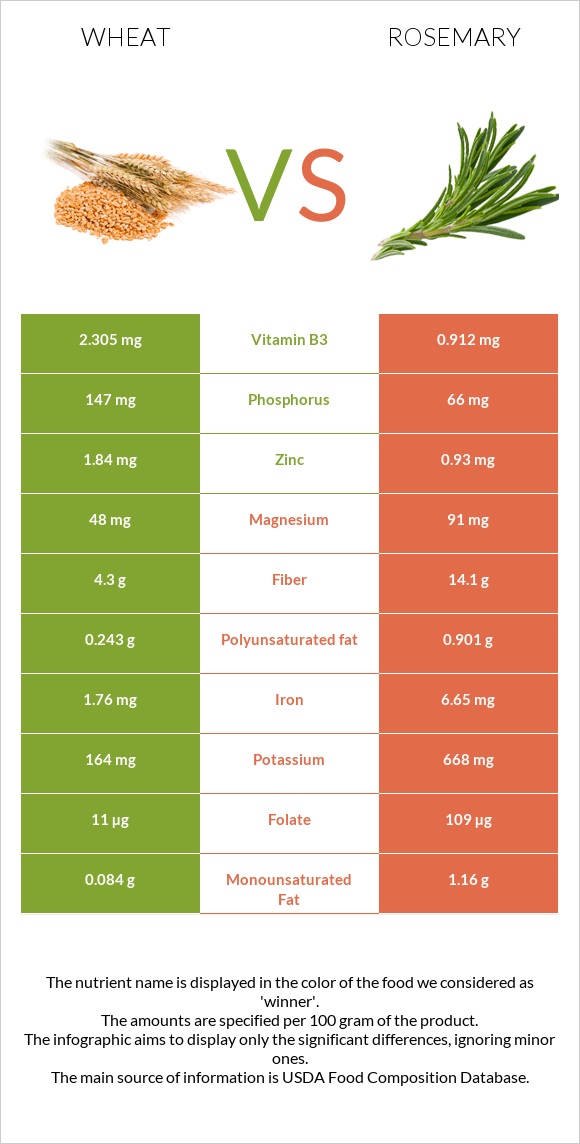
Important differences between wheat and rosemary Wheat has more phosphorus; however, rosemary has more iron, vitamin A, fiber, calcium, folate, vitamin B6, potassium, and copper. Rosemary's daily need coverage for iron is 61% more. Wheat has 2 times more phosphorus than rosemary. Wheat has 147mg of phosphorus, while rosemary has 66mg. Wheat is lower in saturated fat. Rosemary has a higher glycemic index than wheat. The food varieties used in the comparison are Wheat, KAMUT khorasan, cooked and Rosemary, fresh .
Infographic
Mineral Comparison
Mineral comparison score is based on the number of minerals by which one or the other food is richer. The "coverage" charts below show how much of the daily needs can be covered by 300 grams of the food.
4
100 g
300 g
1 cup - 172g
Magnesium
Magnesium
Calcium
Calcium
Potassium
Potassium
Iron
Iron
Copper
Copper
Zinc
Zinc
Phosphorus
Phosphorus
Sodium
Sodium
Manganese
Manganese
Selenium
Selenium
34%
2.7%
14%
66%
69%
50%
63%
1%
134%
174%
5
100 g
300 g
1 tsp - 0.7g 1 tbsp - 1.7g
Magnesium
Magnesium
Calcium
Calcium
Potassium
Potassium
Iron
Iron
Copper
Copper
Zinc
Zinc
Phosphorus
Phosphorus
Sodium
Sodium
Manganese
Manganese
Selenium
Selenium
65%
95%
59%
249%
100%
25%
28%
3.4%
125%
0%
Vitamin Comparison
Vitamin comparison score is based on the number of vitamins by which one or the other food is richer. The "coverage" charts below show how much of the daily needs can be covered by 300 grams of the food.
3
100 g
300 g
1 cup - 172g
Vitamin C
Vit. C
Vitamin D
Vit. D
Vitamin A
Vit. A
Vitamin E
Vit. E
Vitamin B1
Vit. B1
Vitamin B2
Vit. B2
Vitamin B3
Vit. B3
Vitamin B5
Vit. B5
Vitamin B6
Vit. B6
Vitamin B12
Vit. B12
Vitamin K
Vit. K
Folate
Folate
0%
0%
0%
4.8%
24%
6.9%
43%
0%
16%
0%
0%
8.3%
6
100 g
300 g
1 tsp - 0.7g 1 tbsp - 1.7g
Vitamin C
Vit. C
Vitamin D
Vit. D
Vitamin A
Vit. A
Vitamin E
Vit. E
Vitamin B1
Vit. B1
Vitamin B2
Vit. B2
Vitamin B3
Vit. B3
Vitamin B5
Vit. B5
Vitamin B6
Vit. B6
Vitamin B12
Vit. B12
Vitamin K
Vit. K
Folate
Folate
73%
0%
49%
0%
9%
35%
17%
48%
78%
0%
0%
82%
All nutrients comparison - raw data values
Nutrient
DV% diff.
Iron
1.76mg
6.65mg
61%
Selenium
31.9µg
58%
Fiber
4.3g
14.1g
39%
Calcium
9mg
317mg
31%
Folate
11µg
109µg
25%
Vitamin C
21.8mg
24%
Vitamin B6
0.07mg
0.336mg
20%
Vitamin A
146µg
16%
Vitamin B5
0.804mg
16%
Potassium
164mg
668mg
15%
Saturated fat
0.077g
2.838g
13%
Phosphorus
147mg
66mg
12%
Magnesium
48mg
91mg
10%
Copper
0.207mg
0.301mg
10%
Vitamin B2
0.03mg
0.152mg
9%
Vitamin B3
2.305mg
0.912mg
9%
Fats
0.83g
5.86g
8%
Zinc
1.84mg
0.93mg
8%
Protein
5.71g
3.31g
5%
Vitamin B1
0.095mg
0.036mg
5%
Polyunsaturated fat
0.243g
0.901g
4%
Manganese
1.03mg
0.96mg
3%
Monounsaturated fat
0.084g
1.16g
3%
Carbs
27.6g
20.7g
2%
Vitamin E
0.24mg
2%
Sodium
8mg
26mg
1%
Calories
132kcal
131kcal
0%
Protein per 100 calories
4.3g
2.5g
N/A
Calories per 10 g protein
231kcal
396kcal
N/A
Weight per 100 calories
76g
76g
N/A
Unsaturated / Saturated Fat ratio
4.2
0.73
N/A
Net carbs
23.3g
6.6g
N/A
Sugar
3.07g
N/A
Trans fat
0.002g
0g
N/A
Tryptophan
0.051mg
0.051mg
0%
Threonine
0.172mg
0.136mg
0%
Isoleucine
0.22mg
0.136mg
0%
Leucine
0.432mg
0.249mg
0%
Lysine
0.161mg
0.143mg
0%
Methionine
0.097mg
0.047mg
0%
Phenylalanine
0.3mg
0.169mg
0%
Valine
0.267mg
0.165mg
0%
Histidine
0.147mg
0.066mg
0%
Macronutrient Comparison
Macronutrient breakdown side-by-side comparison
2
6%
28%
65%
Protein:
5.71 g
Fats:
0.83 g
Carbs:
27.6 g
Water:
65.18 g
Other:
0.68 g
3
3%
6%
21%
68%
2%
Protein:
3.31 g
Fats:
5.86 g
Carbs:
20.7 g
Water:
67.77 g
Other:
2.36 g
Contains
more
Protein Protein
+72.5%
Contains
more
Carbs Carbs
+33.3%
Contains
more
Fats Fats
+606%
Contains
more
Other Other
+247.1%
Fat Type Comparison
Fat type breakdown side-by-side comparison
1
19%
21%
60%
Saturated fat:
Sat. Fat
0.077 g
Monounsaturated fat:
Mono. Fat
0.084 g
Polyunsaturated fat:
Poly. Fat
0.243 g
2
58%
24%
18%
Saturated fat:
Sat. Fat
2.838 g
Monounsaturated fat:
Mono. Fat
1.16 g
Polyunsaturated fat:
Poly. Fat
0.901 g
Contains
less
Sat. Fat Saturated fat
-97.3%
Contains
more
Mono. Fat Monounsaturated fat
+1281%
Contains
more
Poly. Fat Polyunsaturated fat
+270.8%