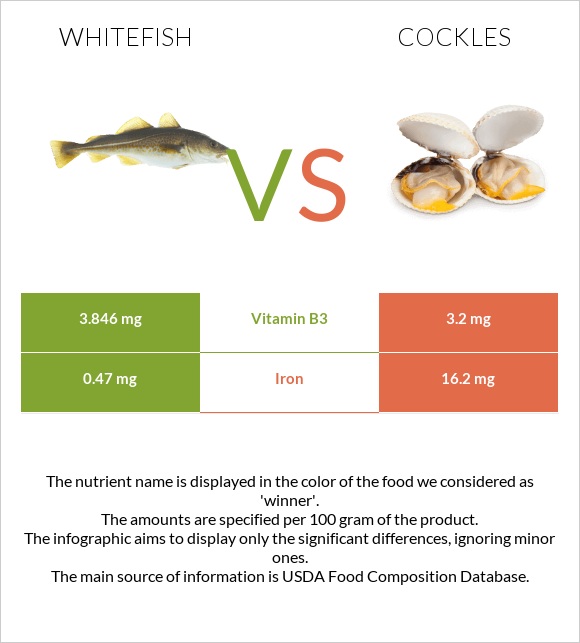
Differences between whitefish and cockles Whitefish has more vitamin B1, while cockles have more iron. Cockles' daily need coverage for iron is 197% higher. Cockles contain 17 times less vitamin B1 than whitefish. Whitefish contains 0.171mg of vitamin B1, while cockles contain 0.01mg. The food types used in this comparison are Fish, whitefish, mixed species, cooked, dry heat and Cockles, raw (Alaska Native) .
Infographic
Mineral Comparison
Mineral comparison score is based on the number of minerals by which one or the other food is richer. The "coverage" charts below show how much of the daily needs can be covered by 300 grams of the food.
7
100 g
300 g
3 oz - 85g 1 fillet - 154g
Magnesium
Magnesium
Calcium
Calcium
Potassium
Potassium
Iron
Iron
Copper
Copper
Zinc
Zinc
Phosphorus
Phosphorus
Sodium
Sodium
Manganese
Manganese
Selenium
Selenium
30%
9.9%
36%
18%
31%
35%
148%
8.5%
11%
88%
2
100 g
300 g
Magnesium
Magnesium
Calcium
Calcium
Potassium
Potassium
Iron
Iron
Copper
Copper
Zinc
Zinc
Phosphorus
Phosphorus
Sodium
Sodium
Manganese
Manganese
Selenium
Selenium
0%
9%
0%
608%
0%
0%
0%
0%
0%
0%
Vitamin Comparison
Vitamin comparison score is based on the number of vitamins by which one or the other food is richer. The "coverage" charts below show how much of the daily needs can be covered by 300 grams of the food.
7
100 g
300 g
3 oz - 85g 1 fillet - 154g
Vitamin C
Vit. C
Vitamin D
Vit. D
Vitamin A
Vit. A
Vitamin E
Vit. E
Vitamin B1
Vit. B1
Vitamin B2
Vit. B2
Vitamin B3
Vit. B3
Vitamin B5
Vit. B5
Vitamin B6
Vit. B6
Vitamin B12
Vit. B12
Vitamin K
Vit. K
Folate
Folate
0%
0%
13%
0%
43%
36%
72%
52%
80%
120%
0%
13%
1
100 g
300 g
Vitamin C
Vit. C
Vitamin D
Vit. D
Vitamin A
Vit. A
Vitamin E
Vit. E
Vitamin B1
Vit. B1
Vitamin B2
Vit. B2
Vitamin B3
Vit. B3
Vitamin B5
Vit. B5
Vitamin B6
Vit. B6
Vitamin B12
Vit. B12
Vitamin K
Vit. K
Folate
Folate
0%
0%
0%
0%
2.5%
46%
60%
0%
0%
0%
0%
0%
All nutrients comparison - raw data values
Nutrient
DV% diff.
Iron
0.47mg
16.2mg
197%
Phosphorus
346mg
49%
Vitamin B12
0.96µg
40%
Selenium
16.2µg
29%
Vitamin B6
0.346mg
27%
Cholesterol
77mg
26%
Protein
24.47g
13.5g
22%
Polyunsaturated fat
2.755g
18%
Vitamin B5
0.865mg
17%
Vitamin B1
0.171mg
0.01mg
13%
Potassium
406mg
12%
Zinc
1.27mg
12%
Fats
7.51g
0.7g
10%
Magnesium
42mg
10%
Copper
0.092mg
10%
Monounsaturated fat
2.559g
6%
Calories
172kcal
79kcal
5%
Saturated fat
1.162g
5%
Vitamin A
39µg
4%
Manganese
0.086mg
4%
Vitamin B2
0.154mg
0.2mg
4%
Vitamin B3
3.846mg
3.2mg
4%
Folate
17µg
4%
Sodium
65mg
3%
Carbs
0g
4.7g
2%
Protein per 100 calories
14g
17g
N/A
Calories per 10 g protein
70kcal
59kcal
N/A
Weight per 100 calories
58g
127g
N/A
Unsaturated / Saturated Fat ratio
4.6
N/A
Net carbs
0g
4.7g
N/A
Calcium
33mg
30mg
0%
Tryptophan
0.274mg
0%
Threonine
1.073mg
0%
Isoleucine
1.128mg
0%
Leucine
1.989mg
0%
Lysine
2.248mg
0%
Methionine
0.724mg
0%
Phenylalanine
0.955mg
0%
Valine
1.261mg
0%
Histidine
0.721mg
0%
Omega-3 - EPA
0.406g
N/A
Omega-3 - DHA
1.206g
N/A
Omega-3 - DPA
0.209g
N/A
Macronutrient Comparison
Macronutrient breakdown side-by-side comparison
3
24%
8%
65%
3%
Protein:
24.47 g
Fats:
7.51 g
Carbs:
0 g
Water:
65.09 g
Other:
2.93 g
2
14%
5%
79%
2%
Protein:
13.5 g
Fats:
0.7 g
Carbs:
4.7 g
Water:
78.8 g
Other:
2.3 g
Contains
more
Protein Protein
+81.3%
Contains
more
Fats Fats
+972.9%
Contains
more
Other Other
+27.4%
Contains
more
Carbs Carbs
+∞%
Contains
more
Water Water
+21.1%