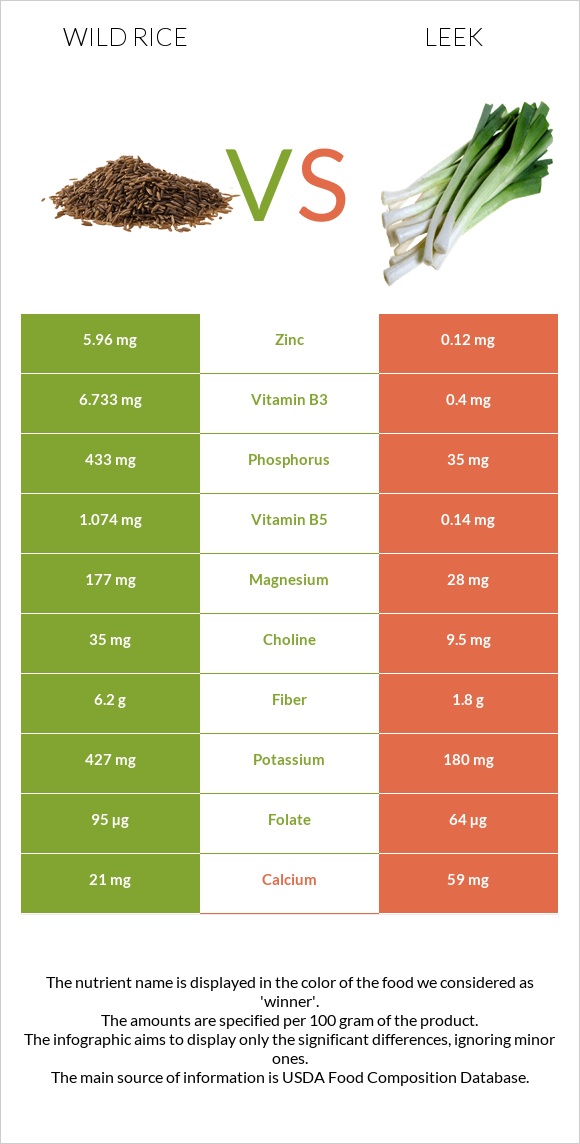
A recap on the differences between wild rice and leeks Wild rice is higher in zinc and phosphorus, yet leeks are higher in vitamin K, vitamin A, iron, vitamin C, folate, manganese, vitamin B6, and calcium. Leeks cover your daily vitamin K needs 39% more than wild rice. Wild rice contains 11 times more zinc than leeks. While wild rice contains 1.34mg of zinc, leeks contain only 0.12mg. The glycemic index of leeks is lower. Food varieties used in this article are Wild rice, cooked and Leeks, (bulb and lower leaf-portion), raw .
Infographic
Mineral Comparison
Mineral comparison score is based on the number of minerals by which one or the other food is richer. The "coverage" charts below show how much of the daily needs can be covered by 300 grams of the food.
4
100 g
300 g
1 cup - 164g
Magnesium
Magnesium
Calcium
Calcium
Potassium
Potassium
Iron
Iron
Copper
Copper
Zinc
Zinc
Phosphorus
Phosphorus
Sodium
Sodium
Manganese
Manganese
Selenium
Selenium
23%
0.9%
8.9%
23%
40%
37%
35%
0.39%
37%
4.4%
5
100 g
300 g
1 slice - 6g 1 cup - 89g 1 leek - 89g
Magnesium
Magnesium
Calcium
Calcium
Potassium
Potassium
Iron
Iron
Copper
Copper
Zinc
Zinc
Phosphorus
Phosphorus
Sodium
Sodium
Manganese
Manganese
Selenium
Selenium
20%
18%
16%
79%
40%
3.3%
15%
2.6%
63%
5.5%
Vitamin Comparison
Vitamin comparison score is based on the number of vitamins by which one or the other food is richer. The "coverage" charts below show how much of the daily needs can be covered by 300 grams of the food.
2
100 g
300 g
1 cup - 164g
Vitamin C
Vit. C
Vitamin D
Vit. D
Vitamin A
Vit. A
Vitamin E
Vit. E
Vitamin B1
Vit. B1
Vitamin B2
Vit. B2
Vitamin B3
Vit. B3
Vitamin B5
Vit. B5
Vitamin B6
Vit. B6
Vitamin B12
Vit. B12
Vitamin K
Vit. K
Folate
Folate
0%
0%
0%
4.8%
13%
20%
24%
9.2%
31%
0%
1.3%
20%
7
100 g
300 g
1 slice - 6g 1 cup - 89g 1 leek - 89g
Vitamin C
Vit. C
Vitamin D
Vit. D
Vitamin A
Vit. A
Vitamin E
Vit. E
Vitamin B1
Vit. B1
Vitamin B2
Vit. B2
Vitamin B3
Vit. B3
Vitamin B5
Vit. B5
Vitamin B6
Vit. B6
Vitamin B12
Vit. B12
Vitamin K
Vit. K
Folate
Folate
40%
0%
28%
18%
15%
6.9%
7.5%
8.4%
54%
0%
118%
48%
All nutrients comparison - raw data values
Nutrient
DV% diff.
Vitamin K
0.5µg
47µg
39%
Iron
0.6mg
2.1mg
19%
Vitamin C
0mg
12mg
13%
Zinc
1.34mg
0.12mg
11%
Folate
26µg
64µg
10%
Vitamin A
0µg
83µg
9%
Manganese
0.282mg
0.481mg
9%
Vitamin B6
0.135mg
0.233mg
8%
Phosphorus
82mg
35mg
7%
Calcium
3mg
59mg
6%
Vitamin B3
1.287mg
0.4mg
6%
Protein
3.99g
1.5g
5%
Vitamin E
0.24mg
0.92mg
5%
Vitamin B2
0.087mg
0.03mg
4%
Calories
101kcal
61kcal
2%
Carbs
21.34g
14.15g
2%
Potassium
101mg
180mg
2%
Magnesium
32mg
28mg
1%
Sodium
3mg
20mg
1%
Vitamin B1
0.052mg
0.06mg
1%
Protein per 100 calories
4g
2.5g
N/A
Calories per 10 g protein
253kcal
407kcal
N/A
Weight per 100 calories
99g
164g
N/A
Fats
0.34g
0.3g
0%
Net carbs
19.54g
12.35g
N/A
Sugar
0.73g
3.9g
N/A
Fiber
1.8g
1.8g
0%
Copper
0.121mg
0.12mg
0%
Selenium
0.8µg
1µg
0%
Vitamin B5
0.154mg
0.14mg
0%
Choline
10.2mg
9.5mg
0%
Saturated fat
0.049g
0.04g
0%
Monounsaturated fat
0.05g
0.004g
0%
Polyunsaturated fat
0.213g
0.166g
0%
Tryptophan
0.049mg
0.012mg
0%
Threonine
0.127mg
0.063mg
0%
Isoleucine
0.167mg
0.052mg
0%
Leucine
0.276mg
0.096mg
0%
Lysine
0.17mg
0.078mg
0%
Methionine
0.119mg
0.018mg
0%
Phenylalanine
0.195mg
0.055mg
0%
Valine
0.232mg
0.056mg
0%
Histidine
0.104mg
0.025mg
0%
Fructose
0.2g
0%
Macronutrient Comparison
Macronutrient breakdown side-by-side comparison
3
4%
21%
74%
Protein:
3.99 g
Fats:
0.34 g
Carbs:
21.34 g
Water:
73.93 g
Other:
0.4 g
2
14%
83%
Protein:
1.5 g
Fats:
0.3 g
Carbs:
14.15 g
Water:
83 g
Other:
1.05 g
Contains
more
Protein Protein
+166%
Contains
more
Fats Fats
+13.3%
Contains
more
Carbs Carbs
+50.8%
Contains
more
Water Water
+12.3%
Contains
more
Other Other
+162.5%
Fat Type Comparison
Fat type breakdown side-by-side comparison
2
16%
16%
68%
Saturated fat:
Sat. Fat
0.049 g
Monounsaturated fat:
Mono. Fat
0.05 g
Polyunsaturated fat:
Poly. Fat
0.213 g
1
19%
2%
79%
Saturated fat:
Sat. Fat
0.04 g
Monounsaturated fat:
Mono. Fat
0.004 g
Polyunsaturated fat:
Poly. Fat
0.166 g
Contains
more
Mono. Fat Monounsaturated fat
+1150%
Contains
more
Poly. Fat Polyunsaturated fat
+28.3%
Contains
less
Sat. Fat Saturated fat
-18.4%