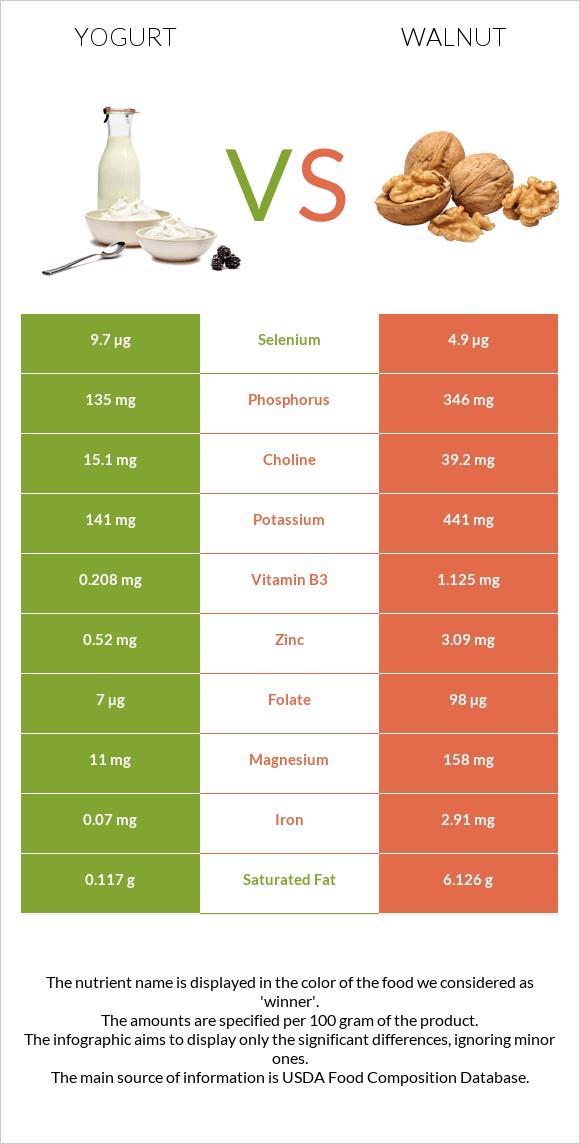
Differences between yogurt and walnut Yogurt has more vitamin B12, while walnut has more copper, manganese, vitamin B6, iron, magnesium, phosphorus, fiber, and vitamin B1. Walnut's daily need coverage for copper is 174% higher. The amount of saturated fat in yogurt is lower. Walnut has a lower glycemic index. The glycemic index of walnut is 0, while the glycemic index of yogurt is 19. The food types used in this comparison are Yogurt, Greek, plain, nonfat and Nuts, walnuts, english .
Infographic
Mineral Comparison
Mineral comparison score is based on the number of minerals by which one or the other food is richer. The "coverage" charts below show how much of the daily needs can be covered by 300 grams of the food.
2
100 g
300 g
1 container - 170g
Magnesium
Magnesium
Calcium
Calcium
Potassium
Potassium
Iron
Iron
Copper
Copper
Zinc
Zinc
Phosphorus
Phosphorus
Sodium
Sodium
Manganese
Manganese
Selenium
Selenium
7.9%
33%
12%
2.6%
5.7%
14%
58%
4.7%
1.2%
53%
8
100 g
300 g
1 cup, in shell, edible yield (7 nuts) - 28g 1 oz (14 halves) - 28.35g 1 cup, ground - 80g 1 cup, chopped - 117g 1 cup pieces or chips - 120g
Magnesium
Magnesium
Calcium
Calcium
Potassium
Potassium
Iron
Iron
Copper
Copper
Zinc
Zinc
Phosphorus
Phosphorus
Sodium
Sodium
Manganese
Manganese
Selenium
Selenium
113%
29%
39%
109%
529%
84%
148%
0.26%
445%
27%
Vitamin Comparison
Vitamin comparison score is based on the number of vitamins by which one or the other food is richer. The "coverage" charts below show how much of the daily needs can be covered by 300 grams of the food.
2
100 g
300 g
1 container - 170g
Vitamin C
Vit. C
Vitamin D
Vit. D
Vitamin A
Vit. A
Vitamin E
Vit. E
Vitamin B1
Vit. B1
Vitamin B2
Vit. B2
Vitamin B3
Vit. B3
Vitamin B5
Vit. B5
Vitamin B6
Vit. B6
Vitamin B12
Vit. B12
Vitamin K
Vit. K
Folate
Folate
0%
0%
0.33%
0.2%
5.8%
64%
3.9%
20%
15%
94%
0%
5.3%
8
100 g
300 g
1 cup, in shell, edible yield (7 nuts) - 28g 1 oz (14 halves) - 28.35g 1 cup, ground - 80g 1 cup, chopped - 117g 1 cup pieces or chips - 120g
Vitamin C
Vit. C
Vitamin D
Vit. D
Vitamin A
Vit. A
Vitamin E
Vit. E
Vitamin B1
Vit. B1
Vitamin B2
Vit. B2
Vitamin B3
Vit. B3
Vitamin B5
Vit. B5
Vitamin B6
Vit. B6
Vitamin B12
Vit. B12
Vitamin K
Vit. K
Folate
Folate
4.3%
0%
0.33%
14%
85%
35%
21%
34%
124%
0%
6.8%
74%
All nutrients comparison - raw data values
Nutrient
DV% diff.
Polyunsaturated fat
0.012g
47.174g
314%
Copper
0.017mg
1.586mg
174%
Manganese
0.009mg
3.414mg
148%
Fats
0.39g
65.21g
100%
Iron
0.07mg
2.91mg
36%
Vitamin B6
0.063mg
0.537mg
36%
Magnesium
11mg
158mg
35%
Vitamin B12
0.75µg
0µg
31%
Calories
59kcal
654kcal
30%
Phosphorus
135mg
346mg
30%
Fiber
0g
6.7g
27%
Vitamin B1
0.023mg
0.341mg
27%
Saturated fat
0.117g
6.126g
27%
Zinc
0.52mg
3.09mg
23%
Folate
7µg
98µg
23%
Monounsaturated fat
0.053g
8.933g
22%
Protein
10.19g
15.23g
10%
Vitamin B2
0.278mg
0.15mg
10%
Potassium
141mg
441mg
9%
Selenium
9.7µg
4.9µg
9%
Vitamin B3
0.208mg
1.125mg
6%
Vitamin E
0.01mg
0.7mg
5%
Vitamin B5
0.331mg
0.57mg
5%
Choline
15.1mg
39.2mg
4%
Carbs
3.6g
13.71g
3%
Cholesterol
5mg
0mg
2%
Vitamin K
0µg
2.7µg
2%
Vitamin C
0mg
1.3mg
1%
Calcium
110mg
98mg
1%
Sodium
36mg
2mg
1%
Protein per 100 calories
17g
2.3g
N/A
Calories per 10 g protein
58kcal
429kcal
N/A
Weight per 100 calories
169g
15g
N/A
Unsaturated / Saturated Fat ratio
0.56
9.2
N/A
Net carbs
3.6g
7.01g
N/A
Sugar
3.24g
2.61g
N/A
Starch
0.06g
0%
Vitamin A
1µg
1µg
0%
Trans fat
0.006g
N/A
Tryptophan
0.17mg
0%
Threonine
0.596mg
0%
Isoleucine
0.625mg
0%
Leucine
1.17mg
0%
Lysine
0.424mg
0%
Methionine
0.236mg
0%
Phenylalanine
0.711mg
0%
Valine
0.753mg
0%
Histidine
0.391mg
0%
Fructose
0g
0.09g
0%
Omega-3 - ALA
0.001g
N/A
Omega-6 - Linoleic acid
0.01g
N/A
Macronutrient Comparison
Macronutrient breakdown side-by-side comparison
1
10%
4%
85%
Protein:
10.19 g
Fats:
0.39 g
Carbs:
3.6 g
Water:
85.1 g
Other:
0.72 g
4
15%
65%
14%
4%
2%
Protein:
15.23 g
Fats:
65.21 g
Carbs:
13.71 g
Water:
4.07 g
Other:
1.78 g
Contains
more
Water Water
+1990.9%
Contains
more
Protein Protein
+49.5%
Contains
more
Fats Fats
+16620.5%
Contains
more
Carbs Carbs
+280.8%
Contains
more
Other Other
+147.2%
Fat Type Comparison
Fat type breakdown side-by-side comparison
1
64%
29%
7%
Saturated fat:
Sat. Fat
0.117 g
Monounsaturated fat:
Mono. Fat
0.053 g
Polyunsaturated fat:
Poly. Fat
0.012 g
2
10%
14%
76%
Saturated fat:
Sat. Fat
6.126 g
Monounsaturated fat:
Mono. Fat
8.933 g
Polyunsaturated fat:
Poly. Fat
47.174 g
Contains
less
Sat. Fat Saturated fat
-98.1%
Contains
more
Mono. Fat Monounsaturated fat
+16754.7%
Contains
more
Poly. Fat Polyunsaturated fat
+393016.7%
Carbohydrate type comparison
Carbohydrate type breakdown side-by-side comparison
2
78%
22%
Starch:
0 g
Sucrose:
0 g
Glucose:
0 g
Fructose:
0 g
Lactose:
2.54 g
Maltose:
0 g
Galactose:
0.7 g
4
2%
91%
3%
3%
Starch:
0.06 g
Sucrose:
2.43 g
Glucose:
0.08 g
Fructose:
0.09 g
Lactose:
0 g
Maltose:
0 g
Galactose:
0 g
Contains
more
Lactose Lactose
+∞%
Contains
more
Galactose Galactose
+∞%
Contains
more
Starch Starch
+∞%
Contains
more
Sucrose Sucrose
+∞%
Contains
more
Glucose Glucose
+∞%
Contains
more
Fructose Fructose
+∞%