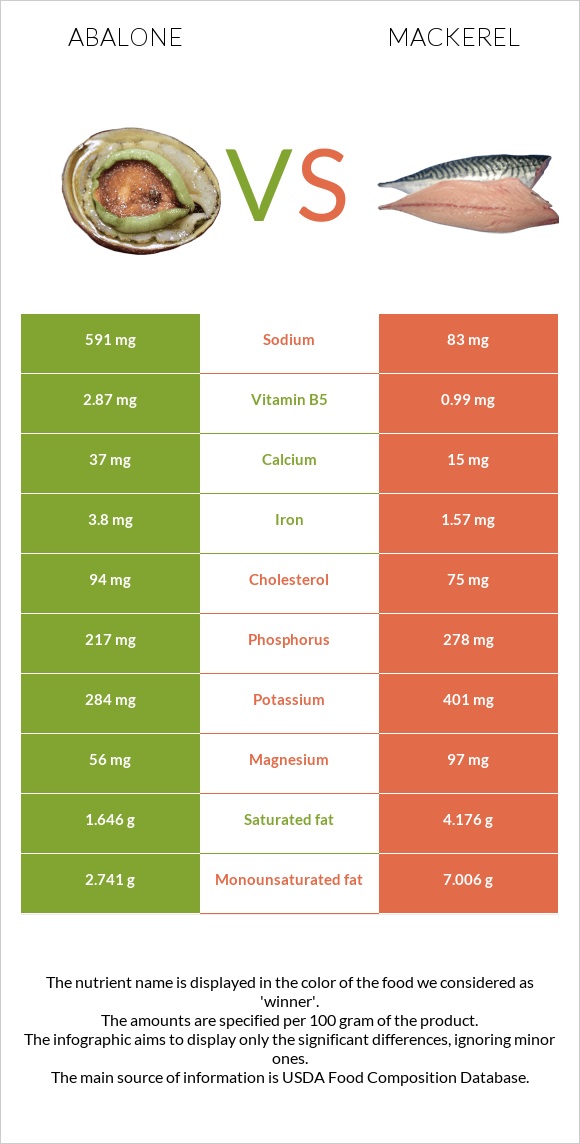
Summary of differences between abalone and mackerel Abalone has more vitamin B5, iron, and copper; however, mackerel is higher in vitamin B12, vitamin B3, vitamin B6, vitamin B2, and magnesium. Mackerel covers your daily need for vitamin B12, 763% more than abalone. Abalone has 7 times more sodium than mackerel. While abalone has 591mg of sodium, mackerel has only 83mg. These are the specific foods used in this comparison Mollusks, abalone, mixed species, cooked, fried and Fish, mackerel, Atlantic, cooked, dry heat .
Infographic
Mineral Comparison
Mineral comparison score is based on the number of minerals by which one or the other food is richer. The "coverage" charts below show how much of the daily needs can be covered by 300 grams of the food.
4
100 g
300 g
3 oz - 85g
Magnesium
Magnesium
Calcium
Calcium
Potassium
Potassium
Iron
Iron
Copper
Copper
Zinc
Zinc
Phosphorus
Phosphorus
Sodium
Sodium
Manganese
Manganese
Selenium
Selenium
40%
11%
25%
143%
76%
26%
93%
77%
9.1%
283%
4
100 g
300 g
3 oz - 85g 1 fillet - 88g
Magnesium
Magnesium
Calcium
Calcium
Potassium
Potassium
Iron
Iron
Copper
Copper
Zinc
Zinc
Phosphorus
Phosphorus
Sodium
Sodium
Manganese
Manganese
Selenium
Selenium
69%
4.5%
35%
59%
31%
26%
119%
11%
2.6%
281%
Vitamin Comparison
Vitamin comparison score is based on the number of vitamins by which one or the other food is richer. The "coverage" charts below show how much of the daily needs can be covered by 300 grams of the food.
4
100 g
300 g
3 oz - 85g
Vitamin C
Vit. C
Vitamin D
Vit. D
Vitamin A
Vit. A
Vitamin E
Vit. E
Vitamin B1
Vit. B1
Vitamin B2
Vit. B2
Vitamin B3
Vit. B3
Vitamin B5
Vit. B5
Vitamin B6
Vit. B6
Vitamin B12
Vit. B12
Vitamin K
Vit. K
Folate
Folate
6%
0%
0.67%
0%
55%
30%
36%
172%
35%
86%
0%
11%
5
100 g
300 g
3 oz - 85g 1 fillet - 88g
Vitamin C
Vit. C
Vitamin D
Vit. D
Vitamin A
Vit. A
Vitamin E
Vit. E
Vitamin B1
Vit. B1
Vitamin B2
Vit. B2
Vitamin B3
Vit. B3
Vitamin B5
Vit. B5
Vitamin B6
Vit. B6
Vitamin B12
Vit. B12
Vitamin K
Vit. K
Folate
Folate
1.3%
0%
18%
0%
40%
95%
128%
59%
106%
2375%
0%
1.5%
All nutrients comparison - raw data values
Nutrient
DV% diff.
Vitamin B12
0.69µg
19µg
763%
Vitamin B5
2.87mg
0.99mg
38%
Vitamin B3
1.9mg
6.85mg
31%
Iron
3.8mg
1.57mg
28%
Vitamin B6
0.15mg
0.46mg
24%
Sodium
591mg
83mg
22%
Vitamin B2
0.13mg
0.412mg
22%
Fats
6.78g
17.81g
17%
Polyunsaturated fat
1.676g
4.3g
17%
Copper
0.228mg
0.094mg
15%
Saturated fat
1.646g
4.176g
12%
Monounsaturated fat
2.741g
7.006g
11%
Magnesium
56mg
97mg
10%
Phosphorus
217mg
278mg
9%
Protein
19.63g
23.85g
8%
Cholesterol
94mg
75mg
6%
Vitamin A
2µg
54µg
6%
Vitamin B1
0.22mg
0.159mg
5%
Calories
189kcal
262kcal
4%
Carbs
11.05g
0g
4%
Potassium
284mg
401mg
3%
Folate
14µg
2µg
3%
Vitamin C
1.8mg
0.4mg
2%
Calcium
37mg
15mg
2%
Manganese
0.07mg
0.02mg
2%
Protein per 100 calories
10g
9.1g
N/A
Calories per 10 g protein
96kcal
110kcal
N/A
Weight per 100 calories
53g
38g
N/A
Unsaturated / Saturated Fat ratio
2.7
2.7
N/A
Net carbs
11.05g
0g
N/A
Zinc
0.95mg
0.94mg
0%
Selenium
51.8µg
51.6µg
0%
Tryptophan
0.224mg
0.267mg
0%
Threonine
0.838mg
1.045mg
0%
Isoleucine
0.854mg
1.099mg
0%
Leucine
1.386mg
1.938mg
0%
Lysine
1.433mg
2.19mg
0%
Methionine
0.441mg
0.706mg
0%
Phenylalanine
0.715mg
0.931mg
0%
Valine
0.86mg
1.228mg
0%
Histidine
0.378mg
0.702mg
0%
Omega-3 - EPA
0.054g
0.504g
N/A
Omega-3 - DHA
0.699g
N/A
Omega-3 - DPA
0.046g
0.106g
N/A
Macronutrient Comparison
Macronutrient breakdown side-by-side comparison
2
20%
7%
11%
60%
2%
Protein:
19.63 g
Fats:
6.78 g
Carbs:
11.05 g
Water:
60.1 g
Other:
2.44 g
3
24%
18%
53%
5%
Protein:
23.85 g
Fats:
17.81 g
Carbs:
0 g
Water:
53.27 g
Other:
5.07 g
Contains
more
Carbs Carbs
+∞%
Contains
more
Water Water
+12.8%
Contains
more
Protein Protein
+21.5%
Contains
more
Fats Fats
+162.7%
Contains
more
Other Other
+107.8%
Fat Type Comparison
Fat type breakdown side-by-side comparison
1
27%
45%
28%
Saturated fat:
Sat. Fat
1.646 g
Monounsaturated fat:
Mono. Fat
2.741 g
Polyunsaturated fat:
Poly. Fat
1.676 g
2
27%
45%
28%
Saturated fat:
Sat. Fat
4.176 g
Monounsaturated fat:
Mono. Fat
7.006 g
Polyunsaturated fat:
Poly. Fat
4.3 g
Contains
less
Sat. Fat Saturated fat
-60.6%
Contains
more
Mono. Fat Monounsaturated fat
+155.6%
Contains
more
Poly. Fat Polyunsaturated fat
+156.6%